In last couple of posts I have shown how to use various tools that are shipped with JDK to troubleshoot various issues , such as hangs, by analyzing stacks. However, obviously there are times where you may have a suspected GC issue or memory leak in production and you will have to capture a heap dump using tools that ship with JDK as well. I already noted previously that Visual VM can be used for that task.
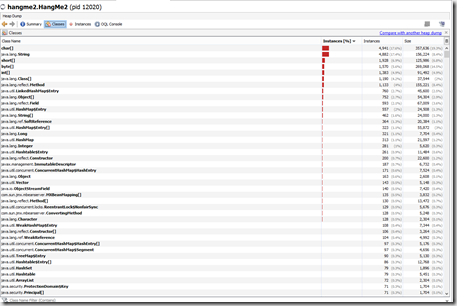
Just right-click on your pid of the process you wish to dump on left pane, pick “Heap Dump” and next you will see lots of information on right pane that may be of interest to you:
Below for example footprint of my class objects by instance count and size:
You can drill down further and see those roots holding these objects live, etc. To me interface and actions are very similar to SciTek .NET Heap Profiler I have used extensively in the past, so it makes it easy.
JMap is a tool that comes with JDK installation as well. Its perhaps less graphical than Visual VM above, but also smaller and has even less overhead for production troubleshooting use. To use it, just like with JStack we will need first to get pid that we are planning to dump:
C:\Program Files\Java\jdk1.7.0_25\bin>jps -l –m
12020 hangme2.HangMe2
30184 sun.tools.jps.
So in my case pid 12020 will need to be dumped.
C:\Program Files\Java\jdk1.7.0_25\bin>jmap -dump:file=C:\Users\gennadyk\Document s\NetBeansProjects\HangMe2.map 12020
Dumping heap to C:\Users\gennadyk\Documents\NetBeansProjects\HangMe2.map ...
Heap dump file created
Now, how do we analyze this dump? Heap dump files can be browsed by the heap dump browser – JHat. Again, as with JStack and JMap, need to do a bit of command line here:
C:\Program Files\Java\jdk1.7.0_25\bin>jhat C:\Users\gennadyk\Documents\NetBeansP
rojects\hangme2.map
Reading from C:\Users\gennadyk\Documents\NetBeansProjects\hangme2.map...
Dump file created Sun Aug 31 16:48:04 EDT 2014
Snapshot read, resolving...
Resolving 132221 objects...
Chasing references, expect 26 dots..........................
Eliminating duplicate references..........................
Snapshot resolved.
Started HTTP server on port 7000
Server is ready.
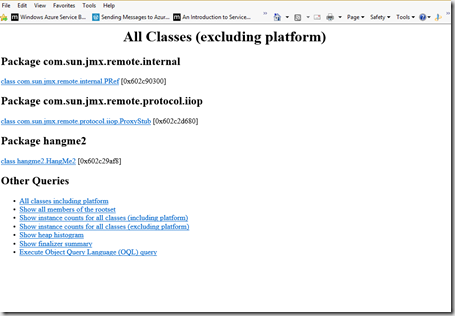
Now lets point my browser to http://localhost:7000 and here is a report one can see:
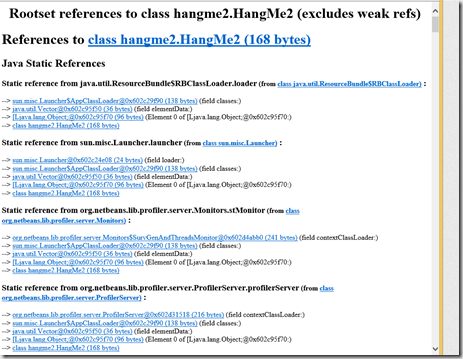
And here is all my live roots\references as I click on hyperlink to drill down on my class:
So with a bit of command line we can now troubleshoot our memory utilization\leaks in JVM with minimal production overhead as needed. Hope above was useful and happy leak hunting.
More information on the tools –
JMap – http://docs.oracle.com/javase/7/docs/technotes/tools/share/jmap.html
JHat – http://docs.oracle.com/javase/7/docs/technotes/tools/share/jhat.html
Troubleshooting guide for Java 6 with HotSpot VM – http://www.oracle.com/technetwork/java/javase/memleaks-137499.html#gdyrr


One thought on “Classic Heap Dump Analysis in JVM Using JMap and JHat”