Meet Redis – Running and basic tutorial for MSOpenTech Redis on Windows


redis

If you have worked on Linux and were interested in NoSQL you probably already heard of Redis. Redis is a data structure server. It is open-source, networked, in-memory, and stores keys with optional durability. The development of Redis has been sponsored by Pivotal Software since May 2013; before that, it was sponsored by VMware. According to the monthly ranking by DB-Engines.com, Redis is the most popular key-value store. The name Redis means REmote DIctionary Server. I have heard people refer to Redis as NoSQL data store, since it  provides the feature saving your data into disk. I have heard people refer to it as distributed cache, as it provides in-memory key-value data store. And someone categorized it to the distributed queue, since it supports storing your data into hash and list type and provides the enqueue, dequeue and pub/sub functionalities. So we are talking about a very powerful product here as you can see. Unfortunately while available and fully supported on Linux platform for some time, Redis itself doesn’t officially support Windows. Fortunately Microsoft Open Technologies (http://msopentech.com/) created a port of Redis that runs on Windows and can be downloaded from Git here – https://github.com/MSOpenTech/Redis. I actually installed this port on my laptop a bit ago, however just found some time to explore it now. Unfortunately looks like folks at Redis are not interested in merging any Windows based code patches into main branch, so at this time and foreseeable future MSOpenTech port will be on its own – http://oldblog.antirez.com/post/redis-win32-msft-patch.html

After you install and build Redis on Windows using Visual Studio you should see something like this in your Redis folder

image

This should create the following executables in the msvs\$(Target)\$(Configuration) folder:

  • redis-server.exe
  • redis-benchmark.exe
  • redis-cli.exe
  • redis-check-dump.exe
  • redis-check-aof.exe

The simplest way to start a Redis server is just to open a command windows and go to this folder, execute the redis-server.exe then you can see the Redis is now running image
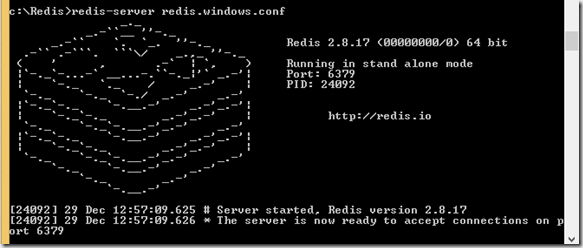
I actually ran into an issue during this step. As I started Redis I immediately saw an error like this:

image

So I had to find a configuration file – redis.windows.conf. There I uncommented maxmemory parameter and set it to 256 MB. Why?

The maxheap flag controls the maximum size of this memory mapped file,
as well as the total usable space for the Redis heap. Running Redis
without either maxheap or maxmemory will result in a memory mapped file
being created that is equal to the size of physical memory. During
fork() operations the total page file commit will max out at around:

    (size of physical memory) + (2 * size of maxheap)

For instance, on a machine with 8GB of physical RAM, the max page file
commit with the default maxheap size will be (8)+(2*8) GB , or 24GB. The
default page file sizing of Windows will allow for this without having
to reconfigure the system. Larger heap sizes are possible, but the maximum
page file size will have to be increased accordingly.
 
The Redis heap must be larger than the value specified by the maxmemory
flag, as the heap allocator has its own memory requirements and
fragmentation of the heap is inevitable. If only the maxmemory flag is
specified, maxheap will be set at 1.5*maxmemory. If the maxheap flag is
specified along with maxmemory, the maxheap flag will be automatically
increased if it is smaller than 1.5*maxmemory.

So here comes the curse of modern laptop with small SSD drive. I only have about 15 GB free on my hard disk and 32 GB RAM. Obviously default behavior here of creating memory mapped file size of my RAM will not work, so I cut maxmemory used here accordingly.

To do anything useful here in console mode we actually have to start Redis Console – redis-cli.exe. Redis has the same basic concept of a database that you are already familiar with. A database contains a set of data.The typical use-case for a database is to group all of an application’s data together and to keep it separate from another application’s. In Redis, databases are simply identified by a number with the default database being number 0. If you want to change to a different database you can do so via the select command.

c:\Redis>redis-cli.exe
127.0.0.1:6379> select 0
OK
127.0.0.1:6379>

While Redis is more than just a key-value store, at its core, every one of Redis’ five data structures has at least a key and a value. It’s imperative that we understand keys and values before moving on to other available pieces of information. I will not go into detail on concept of key-value store here, but lets use redis-cli to add a key-value set and retrieve it via console. To add item I will use set command:

c:\Redis>redis-cli.exe
127.0.0.1:6379> select 0
OK
127.0.0.1:6379> set users:gennadyk '("name";"GennadyK","counry","US")'
OK

So I added an item into users with gennadyk as a key. Next I will use get to retrieve my value:

127.0.0.1:6379> get users:gennadyk
"(\"name\";\"GennadyK\",\"counry\",\"US\")"
127.0.0.1:6379>

Next lets see all of my keys present:

127.0.0.1:6379> keys *
1) "users:gennadyk"
127.0.0.1:6379>

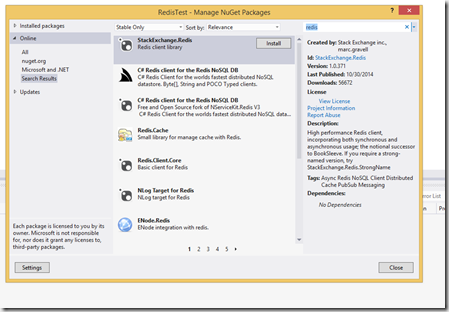
Now that’s basics are done lets create a simple C# application to work with Redis here. I fired  up my VS and started a small Windows console application project named non-surprisingly as Redis test. Next I will go to Manage NuGet packages and pick a client, in my case I will pick StackExchange Redis client library.

image

Just hit Install and you are done here. The code below is pretty simple, but illustrates setting key\value pair strings in Redis and retrieving those as well:

namespace RedisTest
{
    class Program
    {
        static void Main(string[] args)
        {
            ConnectionMultiplexer redis = ConnectionMultiplexer.Connect("localhost");
            IDatabase db = redis.GetDatabase(0);
            int counter;
            string value;
            string key;
            //Create 5 users and put these into Redis
            for (counter = 0; counter < 4; counter++)
            {
                 value = "user" + counter.ToString();
                 key = "5676" + counter.ToString();
                 db.StringSet(key,value);
            }
      
        // Retrieve keys\values from Redis
            for (counter = 0; counter < 4; counter++)
            {
                key = "5676" + counter.ToString();
                value = db.StringGet(key);
                System.Console.Out.WriteLine(key + "," + value);
            }
            System.Console.ReadLine();


        }
    }
}

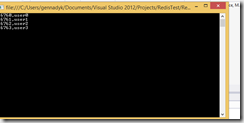
And here is output

image

Looking at the code, central object in StackExchange.Redis is the  ConnectionMultiplexer  class in the  StackExchange.Redis  namespace; this is the object that hides away the details of multiple servers. Because the  ConnectionMultiplexer  does a lot, it is designed to be shared and reused between callers. You should not create a  ConnectionMultiplexer  per operation. Situation here is very similar to DataCacheFactory with Microsoft Windows AppFabricCache NoSQL client – cache and reuse that ConnectionMultiplexer.

A normal production  scenario might involve a master/slave distributed data store setup; for this usage, simply specify all the desired nodes that make up that logical redis tier (it will automatically identify the master):

ConnectionMultiplexer redis = ConnectionMultiplexer.Connect("myserver1:6379,server2:6379");

Rest is even easier. Next I connect to the database (in my case default ) via GetDatabase call. After that I set 5 key\value pair items making sure keys are unique by incrementing these and retrieve these values in the loop based on the key. 

Checking through redis-cli on my server I can see these values now:

127.0.0.1:6379> keys *
1) "56760"
2) "56761"
3) "users:gennadyk"
4) "56763"
5) "56762"
127.0.0.1:6379>

Some other interesting things that I learned, especially around configuration. I already mentioned maxheap and maxmemory parameters.

Parameter Explanation Default value
Port Listening Port 6379
Bind Bind Host IP 127.0.0.1
Timeout Timeout connection 300 sec
loglevel logging level, there are four values, debug, verbose,
notice, warning
verbose
logfile log mode stdout

Hope this helps. For more see – http://www.databaseskill.com/645056/, http://stevenmaglio.blogspot.com/2014/10/quick-redis-with-powershell.html, https://github.com/StackExchange/StackExchange.Redis
Vade indigena–Troubleshooting Native Memory Leaks with GFLAGS AND UDMH

Unmanaged memory leaks in legacy code are notoriously hard to troubleshoot. Majority of developers unfortunately become aware of leaks only when application throws a notorious OOM (Out of Memory) exception, not during development or testing. Tracking for leaks requires relatively specialized testing, including running long running “soak” tests and tracking memory footprint over the course of hours and sometimes even days.

So, unfortunately most memory leaks are found not during development or testing, but rather in production. At that time situation quickly becomes critical and you have to find answers to following in production:

  • Which objects are leaking memory?
  • Why these objects are leaking, perhaps there is a static reference or they are simply are not freed?

Its somewhat easier in managed code, such as .NET or Java. In .NET for example you have options to do following:

  • Use memory leak DebugDiag rule and taking dumps at certain intervals use extensions such as SOS or Tom Christian’s PSSCOR with WinDBG to analyze memory footprint over time, including looking at roots, gchandles , finalization queue, etc.
  • Use Profiler tools such as free CLRProfiler, or SciTek Memory Profiler, or RedGate ANTS to profile memory utilization. May be a bit heavy for production, but possible.
  • Use PerfView utility based on ETW (Event Tracing for Windows) as lightweight memory profiler

It’s a lot different for unmanaged\native code in Windows. There are few methods available, my favorite was always use DebugDiag memory leak rule with LeakTrak dll injected into the process that would track allocations and allocation stacks. However, I love to state that sometimes you learn new methods and here is one I learned this week. I was so excited that I decided to blog and share this method ASAP.

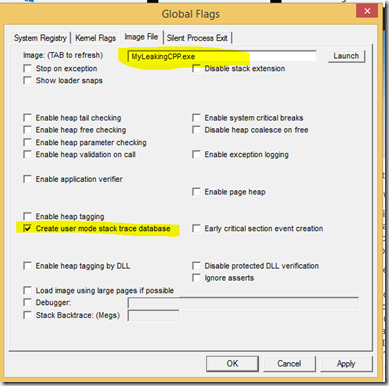
The first thing we have to do is inform the heap service of Windows that we want to track down allocations for a specific process. Once again, it’s the magic tool GFlags that we have to use that is a part of Debugging Tools for Windows. I previously shown how GFlags can be used to troubleshoot the worst unmanaged heap issue of them all – heap corruption. If you start it up and navigate to Image File tab, where you will enter your leaking application name\path (ex. c:\Program Files\mybadapp\mybadapp.exe) into Image textbox. Next check Create User Mode Stack Trace Database checkbox.

image

By checking the “Create user mode stack trace database”, you notify the Windows  heap service that it has to record the call stack for each allocation done in the heap- http://msdn.microsoft.com/en-us/library/windows/hardware/ff540107(v=vs.85).aspx.

Another way to turn on these settings would be through command line:

gflags /i <application> +ust

This command should have the output:

Current Registry Settings for MyLeakingCPP.exe executable are: 00000000

To verify that gflags.exe was used correctly, you can create dump of the process , open dump in WinDBG and do following

0:000> !gflag
 Current NtGlobalFlag contents: 0x00001040
 hpc - Enable heap parameter checking
 ust - Create user mode stack trace database

So now with gflags set, next step is learning about another tool that ships with Debugging Tools for Windows – UDMH. UDMH can take a snapshot of the allocation data at a specific time, and also compare two snapshots. So idea here is start process , take a snapshot, repro that leak, while watching private bytes for the process in Windows Performance Monitor, when process grown quite a bit take another snapshot. Finally compare these two snapshots.

So, once you set up gflags, start process “clean” . Once you want to take a snapshot, start a command line. Make sure that environment variable _NT_SYMBOL_PATH is set to following:

  • srv*<some local cache folder>*http://msdl.microsoft.com/Download/Symbols , if your company doesn’t have its own symbol server
  • srv*<some local cache folder>*<your symbol server path>;srv*<some local cache folder>*http://msdl.microsoft.com/Download/Symbols, if your company has its own symbol server or share

Whether you define this environment variable at system level, or only in your command line, make sure it is set with the right information. For more on symbol path see – http://msdn.microsoft.com/en-us/library/windows/hardware/ff558829(v=vs.85).aspx

Now lets take that snapshot. In command line:

C:\Debugging Tools for Windows>umdh –p: -f:MySnapshot0.txt

Now reproduce the issue as much as you can, grow those private bytes and take next snapshot:

C:\Debugging Tools for Windows>umdh –p: -f:MySnapshot1.txt

Now lets compare both, again in command line:

C:\Debugging Tools for Windows>umdh –d MySnapshot0.txt MySnapshot1.txt -f:MyResult.txt

Now the contents of MyResult.txt will contain all memory leaks plus a stack trace which reflects the location where memory was allocated, but never subsequently freed.

Finally if the symbols are resolved correctly you should see something like deltas with allocation stacks below:

+ 5760144 ( 5760144 –      0)      26 allocs    BackTrace1178AC
 +       16 (      6 –      0)    BackTrace1178AC    allocations

ntdll!RtlAllocateHeap+00000274
 MSVCR100D!_heap_alloc_base+00000053 
 MSVCR100D!_heap_alloc_dbg_impl+000001FC 
 MSVCR100D!_nh_malloc_dbg_impl+0000001F 
 MSVCR100D!_nh_malloc_dbg+0000002C 
 MSVCR100D!malloc+0000001B 
 MSVCR100D!operator new+00000011 
 MyLeakingCPP new[]+0000000E 
MyLeakingCPP!wmain+000000A7 
 MyLeakingCPP!__tmainCRTStartup+000001BF 
 MyLeakingCPP!wmainCRTStartup+0000000F 
 kernel32!BaseThreadInitThunk+0000000E
 ntdll!__RtlUserThreadStart+00000070
 ntdll!_RtlUserThreadStart+0000001B

For more see – http://support.microsoft.com/kb/268343, http://msdn.microsoft.com/en-us/library/windows/hardware/ff560206(v=vs.85).aspx, http://nvharikrishna.wordpress.com/2012/07/11/umdh-a-simple-tool-for-memory-leak-detection-in-windows/ and https://htcondor-wiki.cs.wisc.edu/index.cgi/wiki?p=LeakDetectionInUserMode

Mission Control To Major Tom – Exploring Java Mission Control (JMC) for Nearly Zero Overhead Troubleshooting

In this post I will attempt to take a look at Java Mission Control, a tool born out of Oracle’s merger with Sun Microsystems and therefore a convergence between Oracle JRockit VM and Hotspot VM. Included in the latest Java 7 JDK update (‘7u40′) is a new powerful monitor tool: Java Mission Control (JMC). JMC is a production time tool that has its roots in the JRockit JVM tooling. It is located in the bin folder of your  JDK. Oracle actually has done a good job advertising this tool via JavaOne conference and on their site – http://www.oracle.com/technetwork/java/javaseproducts/mission-control/index.html

Mission Control provides largely the same functionality as Java Visual VM. Both tools allow connecting to local or remote Java processes to collect JMX data. Mission Control supports automatic discovery of running remote JVMs via the Java Discovery Protocol. To use it the JVM needs to be started with

-Dcom.sun.management.jmxremote.autodiscovery=true -Dcom.sun.management.jdp.name=JVM_Name

Similarly to Java Visual VM, Mission Control has a plugin mechanism, allowing for customization. But unlike Java VisualVM, Mission Control can also be used to create new views on the data collected. Two experimental plugins available today are JOverflow Heap Analyzer for finding inefficient use of Collections and DTrace Recorder for correlating DTrace profiles. Mission Control has a JMX browser as part of its core features and offers slightly more powerful functionality across the board. For example, the thread monitoring can provide per thread allocation information and on the fly stack traces. Because Mission Control is based on the Eclipse Platform, it is not only available as standalone tool within the JDK, but also as Eclipse plugin which can be obtained on the Oracle Mission Control Update Site.

Java Mission Control uses JMX to communicate with remote Java processes. The JMX Console is a tool for monitoring and managing a running JVM instance. The tool presents live data about memory and CPU usage, garbage collections, thread activity, and more. It also includes a fully featured JMX MBean browser that you can use to monitor and manage MBeans in the JVM and in your Java application.

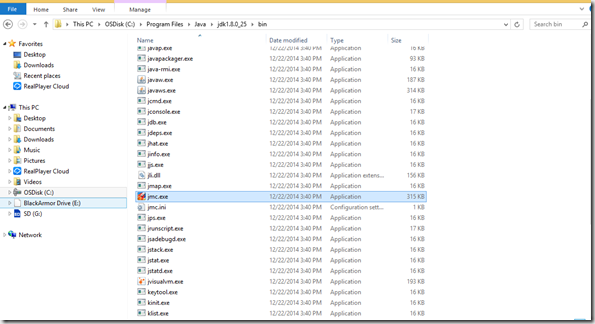
So after installing JDK 7u40 and above you should note tool right there in your JDK bin folder:

image

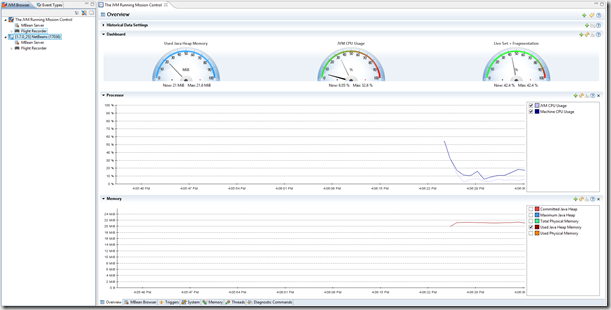
After starting JMC you will note it has few parts that can be helpful, just like Java Visual VM again.  Note pretty nice JMS Console that allows you to see\monitor general parameters on the machine like JVM CPU, Heap Memory, etc..


image

But more interesting to me is feature called Flight Recorder. For reason of illustrating of how it works I created a rather very simple application that does a tight loop and should create some CPU usage and contention on my laptop.  The application is pretty basic and somewhat embarrassing, but since its not the point here, here it is:

package highcpu;

/**
 *
 * @author gennadyk
 */
public class HighCPU {

    /**
     * @param args the command line arguments
     */
    public static void main(String[] args) {
        LoopMeToHighCPU(100000000);
    }
    
    public static void LoopMeToHighCPU(int iterations){
       
       int counter;
       for (counter=0;counter< } counter); + ? is: System.out.println(?Count {>

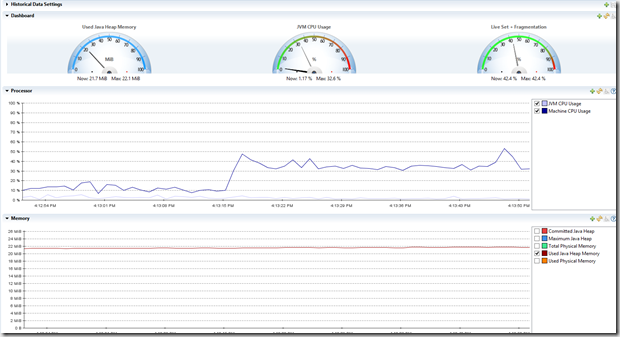
Looking at JMS Console I can see that its working.

image

But that’s not overly interesting to me, what I am interesting in is taking capture with Flight Control and finding out what is using my CPU from that capture.

To Take Flight Recorder Capture:

  • Start the application you want to profile with the following arguments to enable the flight recorder:
    -XX:+UnlockCommercialFeatures -XX:+FlightRecorder 

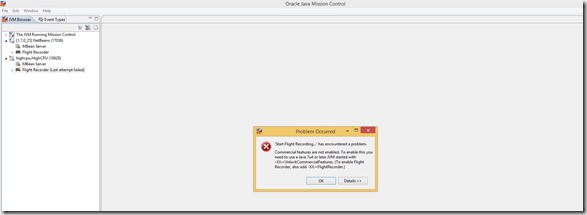
If you don’t set that up you will see an error like:

jmc

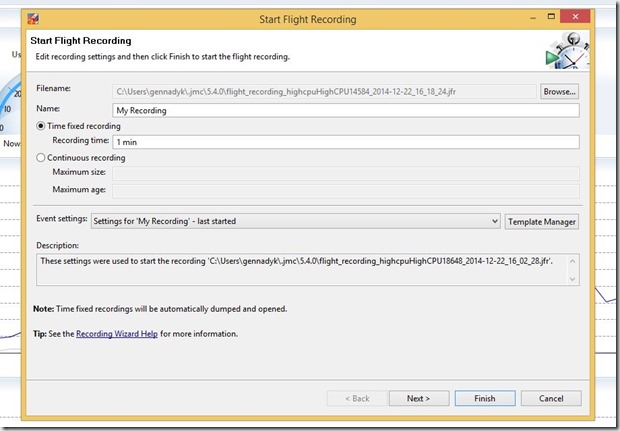
  • Next start Mission Control. You can just double click on jmc in the bin folder of your 7u40 JDK. (Close the Welcome screen if this is your first time starting JMC.) .Right click on the JVM you wish to start a flight recording on in the JVM browser and select Start Flight Recording.

Capture

  • Leave all the default settings and select the ‘Profiling – on server’ template for your Event Settings. You can usually just hit finish at this point, but I’d like to talk a bit on how you can control the method sampler.
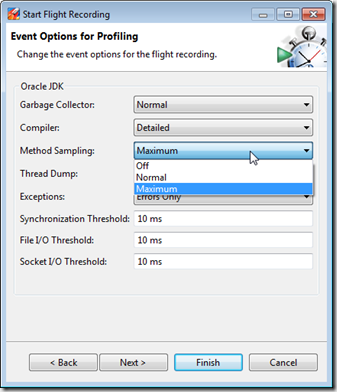
  • Click Next to go to the higher level event settings. These are groupings of named settings in the template. Here you can select how often you want JFR to sample methods by changing the Method Sampling setting.

MethodSamplingSettings

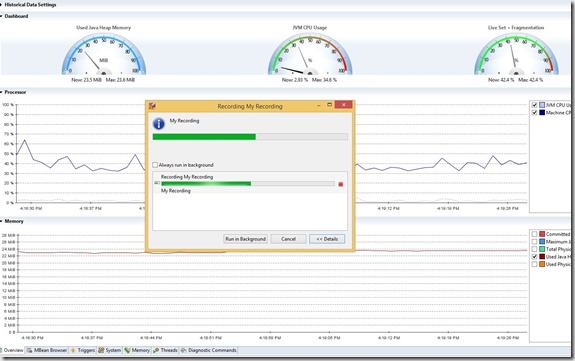
  • Hit Finish and we are in business – application is now recorded:

Capture2

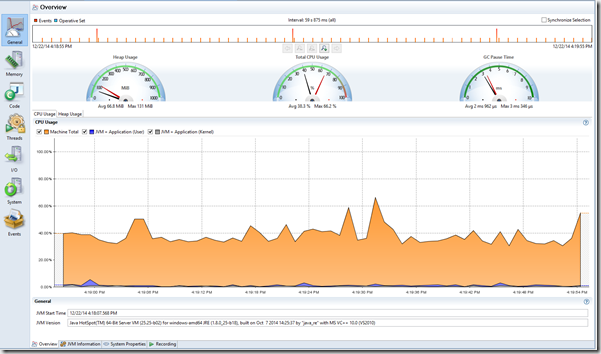
Now lets open Flight Recorder capture in JMC. You can do that via File->Open or Ctrl->O

image

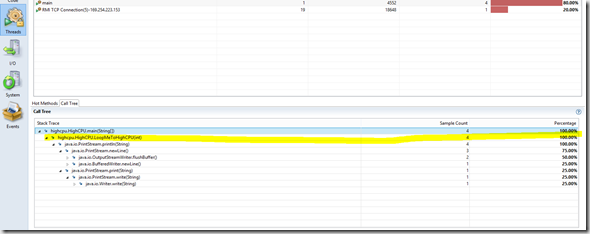
I am obviously interested in Threads View here and looking at Hot Threads Call Tree can easily see my self created issue (see highlighted):

image


Disclaimer: A Word On Licensing
The tooling is part of the Oracle JDK downloads. In particular the JMC 5.4 is part of JDK 8u20 and JDK 7u71 and is distributed under the Oracle Binary Code License Agreement for Java SE Platform products and commercially available features for Java SE Advanced and Java SE Suite. IANAL, but as far as I know this allows for using it for your personal education and potentially also as part of your developer tests. Make sure to check back with whomever you know that could answer this question, most likely at Oracle. This blog uses tool for educational purposes only and as a how to for developer testing and production code troubleshooting.

Fore more on JMC see – http://hirt.se/blog/?p=343, http://hirt.se/blog/?p=364, and http://www.oracle.com/technetwork/java/javaseproducts/mission-control/index.html

Hope this helps.

Azure Quick Tasks -Enabling Azure Diagnostics via Configuration

As my customers started moving to Azure PaaS, I started getting a lot of questions about enabling logging and tracing in Azure. So usual way to enable and trace out of Azure PaaS currently is provided via WAD (Windows Azure Diagnostics).  There are lots of articles on this subject, goal here is to show you how to quickly enable this feature via diagnostics.wadcfg, i.e. via configuration.

Assuming you are working in Visual Studio, in your solution just right click on WebRole or Worker Role you are working with and pick properties that would open where you can turn on logging (it will enable it in config)

clip_image001

That underneath writes a file called diagnostics.wadcfg with configuration. This is what I have in my example in it:

<?xml version=”1.0″ encoding=”utf-8″?>
<DiagnosticMonitorConfiguration configurationChangePollInterval=”PT1M” overallQuotaInMB=”4096″ xmlns=”
http://schemas.microsoft.com/ServiceHosting/2010/10/DiagnosticsConfiguration”>
<DiagnosticInfrastructureLogs />
<Directories>
<IISLogs container=”wad-iis-logfiles” />
<CrashDumps container=”wad-crash-dumps” />
</Directories>
<Logs bufferQuotaInMB=”1024″ scheduledTransferPeriod=”PT1M” scheduledTransferLogLevelFilter=”Verbose” />
<WindowsEventLog bufferQuotaInMB=”1024″ scheduledTransferPeriod=”PT1M” scheduledTransferLogLevelFilter=”Verbose”>
<DataSource name=”Application!*” />
</WindowsEventLog>
<PerformanceCounters bufferQuotaInMB=”512″ scheduledTransferPeriod=”PT0M”>
<PerformanceCounterConfiguration counterSpecifier=”\Memory\Available MBytes” sampleRate=”PT3M” />
<PerformanceCounterConfiguration counterSpecifier=”\Web Service(_Total)\ISAPI Extension Requests/sec” sampleRate=”PT3M” />
<PerformanceCounterConfiguration counterSpecifier=”\Web Service(_Total)\Bytes Total/Sec” sampleRate=”PT3M” />
<PerformanceCounterConfiguration counterSpecifier=”\ASP.NET Applications(__Total__)\Requests/Sec” sampleRate=”PT3M” />
<PerformanceCounterConfiguration counterSpecifier=”\ASP.NET Applications(__Total__)\Errors Total/Sec” sampleRate=”PT3M” />
<PerformanceCounterConfiguration counterSpecifier=”\ASP.NET\Requests Queued” sampleRate=”PT3M” />
<PerformanceCounterConfiguration counterSpecifier=”\ASP.NET\Requests Rejected” sampleRate=”PT3M” />
</PerformanceCounters>
</DiagnosticMonitorConfiguration>

Note above that I am picking up certain perfmon counters, event logs , IIS logs and even crash dumps.  That is setting in Diagnostics area in Config screen above.

This is what I have in my in my app.config, meaning there is a Listener entry:

<system.diagnostics>

<trace>

<listeners>

<add type=”Microsoft.WindowsAzure.Diagnostics.DiagnosticMonitorTraceListener, Microsoft.WindowsAzure.Diagnostics, Version=2.2.0.0, Culture=neutral, PublicKeyToken=31bf3856ad364e35″

name=”AzureDiagnostics”>

<filter type=”” />

</add>

</listeners>

</trace>

</system.diagnostics>

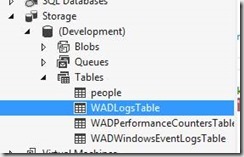
If you have configured Diagnostics as per screen above you will note that it automatically will create WadLogs table for you where traces will go.

clip_image002

WAD automatically maps the wad-crash-dumps, wad-frq, and wad-iis containers to special folders which only exist in web and worker roles.  For VM roles comment out the CrashDumps, FailedRequestLogs, and IISLogs elements.

Finally, there are the various “QuotaInMB” settings.  WAD automatically allocates 4096 MB of local storage named DiagnosticStore.  WAD fails if the overallQuotaInMB value is set higher than the local storage allocated or if the various “QuotaInMB” values add up to within about 750 MB of overallQuotaInMB.  Either:

  • Decrease some of the “QuotaInMB” values until the config works.

or

  • Add a LocalStorage setting named DiagnosticStore to ServiceDefinition.csdef and increase overallQuotaInMB.

For more I recommend – http://www.davidaiken.com/2012/02/27/how-to-use-diagnostics-wadcfg-to-configure-windows-azure-diagnostics-collection/, http://blogs.msdn.com/b/davidhardin/archive/2011/02/26/wad-is-built-on-etw.aspx

Hope this was useful.