Obscure Internis – SQL Server and NUMA internals

In my professional history with SQL Server I have seen this topic frequently misunderstood. I have seen consultants blaming NUMA for every single evil with certain systems and turning it off proactively going to SMP, while others never actually knew anything about NUMA and paid no attention to it. NUMA is important, but blaming it for all your SQL issues without evidence is wrong, however on the other hand you should be aware of it and how it affects SQL Server performance.

Non-uniform memory access (NUMA) is a computer memory design used in multiprocessing, where the memory access time depends on the memory location relative to the processor. Under NUMA, a processor can access its own local memory faster than non-local memory (memory local to another processor or memory shared between processors). The benefits of NUMA are limited to particular workloads, notably on servers where the data are often associated strongly with certain tasks or users.

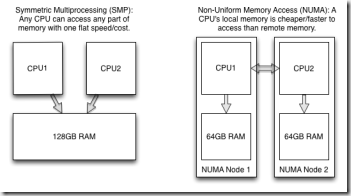
Previous to introduction of NUMA, things were arguable simpler where architecture used was pure SMP. Symmetric multiprocessing (SMP) involves a symmetric multiprocessor system hardware and software architecture where two or more identical processors connect to a single, shared main memory, have full access to all I/O devices, and are controlled by a single operating system instance that treats all processors equally, reserving none for special purposes.

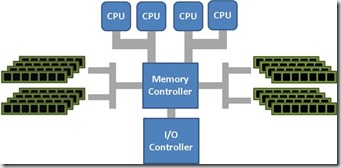
This is how SMP vs. NUMA look logically:

clip_image002

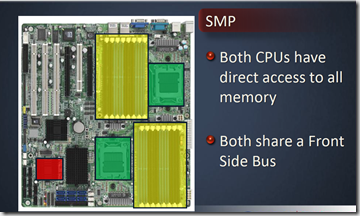
This is how its actually looking in terms of hardware motherboard:

SMP, note single memory bus for access

image

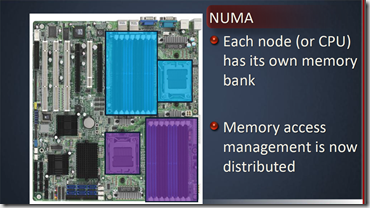
NUMA, note each CPU has its own memory:

image

Modern CPUs operate considerably faster than the main memory they use. In the early days of computing and data processing, the CPU generally ran slower than its own memory. The performance lines of processors and memory crossed in the 1960s with the advent of the first supercomputers. Since then, CPUs increasingly have found themselves “starved for data” and having to stall while waiting for data to arrive from memory. Many supercomputer designs of the 1980s and 1990s focused on providing high-speed memory access as opposed to faster processors, allowing the computers to work on large data sets at speeds other systems could not approach.

Limiting the number of memory accesses provided the key to extracting high performance from a modern computer. For commodity processors, this meant installing an ever-increasing amount of high-speed cache memory and using increasingly sophisticated algorithms to avoid cache misses. But the dramatic increase in size of the operating systems and of the applications run on them has generally overwhelmed these cache-processing improvements. Multi-processor systems without NUMA make the problem considerably worse. Now a system can starve several processors at the same time, notably because only one processor can access the computer’s memory at a time.[2]

NUMA attempts to address this problem by providing separate memory for each processor, avoiding the performance hit when several processors attempt to address the same memory. For problems involving spread data (common for servers and similar applications), NUMA can improve the performance over a single shared memory by a factor of roughly the number of processors (or separate memory banks).[3] Another approach to addressing this problem, utilized mainly by non-NUMA systems, is the multi-channel memory architecture; multiple memory channels are increasing the number of simultaneous memory accesses.

The main benefit of NUMA is scalability. The NUMA architecture was designed to surpass the scalability limits of the SMP architecture. With SMP, all memory access is posted to the same shared memory bus. This works fine for a relatively small number of CPUs, but not when you have dozens, even hundreds, of CPUs competing for access to the shared memory bus. NUMA alleviates these bottlenecks by limiting the number of CPUs on any one memory bus and connecting the various nodes by means of a high speed interconnection.

clip_image002

SQL Server and NUMA.

SQL Server groups schedulers to map to the grouping of CPUs, based on the hardware NUMA boundary exposed by Windows. For example, a 16-way box may have 4 NUMA nodes, each node having 4 CPUs. This allows for a greater memory locality for that group of schedulers when tasks are processed on the node. With SQL Server you can further subdivide CPUs associated with a hardware NUMA node into multiple CPU nodes. This is known as soft-NUMA. Typically, you would subdivide CPUs to partition the work across CPU nodes.

When a thread running on a specific hardware NUMA node allocates memory, the memory manager of SQL Server tries to allocate memory from the memory associated with the NUMA node for locality of reference. Similarly, buffer pool pages are distributed across hardware NUMA nodes. It is more efficient for a thread to access memory from a buffer page that is allocated on the local memory than to access it from foreign memory. For more information, see Growing and Shrinking the Buffer Pool Under NUMA.

Each NUMA node (hardware NUMA or soft-NUMA) has an associated I/O completion port that is used to handle network I/O. This helps distribute the network I/O handling across multiple ports. When a client connection is made to SQL Server, it is bound to one of the nodes. All batch requests from this client will be processed on that node.

Common Issues affecting SQL Server performance:

Local vs. Foreign memory imbalance leading to increased query latency and performance issues.  This is best documented here – http://blogs.msdn.com/b/psssql/archive/2010/02/23/how-it-works-sql-server-2008-numa-and-foreign-pages.aspx.

I mentioned above idea of “local” memory to the scheduler\CPU and “remote” memory. Not only remote access is more expensive, when Microsoft SQL Server 2012 requires memory in non-uniform memory access (NUMA)-enabled environments, Windows may allocate too much memory from a remote node before allocating a page of local memory. This issue is the one fixed in Cumulative update package 3 for SQL Server 2012 Service Pack 1. Workaround without a fix is to disable NUMA by enabling trace flag 8015 when the SQL Server service starts. This workaround directs the SQL Server Memory manager to treat all memory as a single node, therefore turning off NUMA in SQL Server, just as I had to do few times in the past
How would we actually see an issue with SQL Server performance counters:

Performance Counter Description
Buffer Node: Local node page lookups/sec Database page reads and writes that are satisfied from the local buffer pool node. 

Note:  This does not indicate if the memory for the page is local or remote to the node.  It is possible the physical memory allocation is remote/away/foreign but assigned to the node in a steady state so the server is still doing a remote memory access.

Buffer Node: Remote node page lookups/sec Database page reads and writes that are satisfied from the remote buffer pool node. 

This is normally a physical, remote memory access because of the sorting that SQL Server performs.

Bad performance on newer\bigger machines with 8 logical CPUs per NUMA node.

This best documented here – http://blogs.msdn.com/b/psssql/archive/2011/09/01/sql-server-2008-2008-r2-on-newer-machines-with-more-than-8-cpus-presented-per-numa-node-may-need-trace-flag-8048.aspx. The issue can be identified via by looking as the DMVs dm_os_wait_stats and dm_os_spin_stats for types (CMEMTHREAD and SOS_SUSPEND_QUEUE).

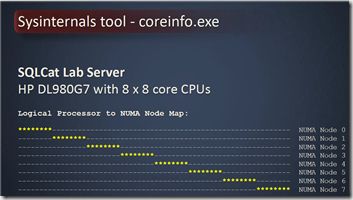
You can use SysInternals CoreInfo.exe utility to perform NUMA node alignment checks to CPUs. Please download coreinfo .exe and run it in a command window. It is best to pipe the result into a text file which can be opened with notepad. E.g. coreinfo > structure.txt. It is expected that the program execution just takes a few seconds:

image

The symbol ‘*’ characterizes one Logical Processors thread being a part of the processor group. The sign ‘-‘symbolizes a Logical Processors thread which is not part of a processor group.    

Encountering Processor Groups which are uneven in terms of CPU resources, dealing with applications which are not Processor Group aware combined with Windows’ random assignment of such applications to one of the processor groups can cause a non-deterministic behavior of non-processor-groups aware applications. Restarting such an application might get it assigned to a different Processor Group with more or less CPU resources as before and hence cause different behavior under workload applied to it.

In order to be able to get determinable performance for  SQL Server we recommend to configure Windows Server 2008 R2 to create Processor Groups with the same number of Logical Processor threads per Processor Group. In order to get there.

On Windows 2008 R2 with large number of processors easiest way to get to an even number of Logical Processors threads is to apply a QFE which got released by Microsoft in March 2011. The QFE and the related Knowledgebase Article from Microsoft can be found here: http://support.microsoft.com/kb/2510206.

You can see more on your NUMA nodes in SQL Server using sys_dm_os_schedulers and sys.dm_os_nodes

For more see – http://blogs.msdn.com/b/psssql/archive/2015/03/02/running-sql-server-on-machines-with-more-than-8-cpus-per-numa-node-may-need-trace-flag-8048.aspx, http://blogs.msdn.com/b/psssql/archive/2014/02/04/as-the-world-turns-sql-server-numa-memory-node-and-the-operating-system-proximity.aspx, http://blogs.msdn.com/b/psssql/archive/2011/11/11/sql-server-clarifying-the-numa-configuration-information.aspx
Dancing With Elephants -Hadoop 2: Introduction To Yarn

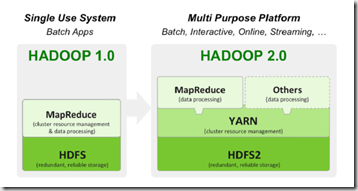
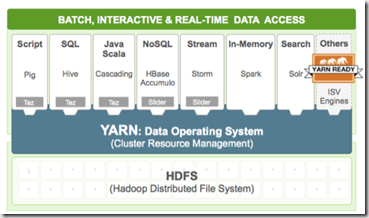
In my previous blog entry I profiled Hadoop HDFS , now I will go one step higher in Hadoop architecture and introduce YARN.  YARN was added for efficient resource management and scheduling relatively recently in Hadoop 2.0, previously MapReduce was a layer used in that role exclusively..

image

As you can see above this is relatively large change with YARN now taking its place as “data OS” on top of HDFS and MapReduce becoming another framework on top of YARN, just like many others.

image

YARN stands for “Yet-Another-Resource-Negotiator”. It is a new framework that facilitates writing arbitrary distributed processing frameworks and applications.

YARN provides the daemons and APIs necessary to develop generic distributed applications of any kind, handles and schedules resource requests (such as memory and CPU) from such applications, and supervises their execution.

YARN’s execution model is more generic than the earlier MapReduce implementation. YARN can run applications that do not follow the MapReduce model, unlike the original Apache Hadoop MapReduce.

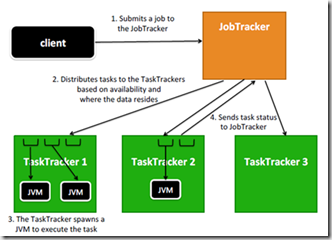
YARN pretty radically changes MapReduce internals. Mapreduce 1.0 had following workflow:

image

Note there is a single point of failure here – JobTracker. Job Tracker is a “master” component of Task Trackers. Client submit MapReduce jobs to Job Tracker which distributes tasks to Task Trackers.Task Trackers run on Data Node and perform actual MapReduce jobs.

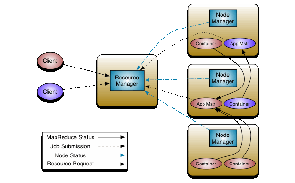
With the advent of YARN, there is no longer a single JobTracker to run jobs and a TaskTracker to run tasks of the jobs. The old MapReduce 1.0 framework was rewritten to run within a submitted application on top of YARN. This application was christened MR2, or MapReduce version 2. It is the familiar MapReduce execution underneath, except that each job now controls its own destiny via its own ApplicationMaster taking care of execution flow (such as scheduling tasks, handling speculative execution and failures, etc.). It is a more isolated and scalable model than the MR1\Map Reduce 1.0 system where a singular JobTracker does all the resource management, scheduling and task monitoring work.

yarn_architecture

The ResourceManager has two main components: Scheduler and ApplicationsManager:

  • The Scheduler is responsible for allocating resources to the various running applications subject to familiar constraints of capacities, queues etc. The Scheduler is pure scheduler in the sense that it performs no monitoring or tracking of status for the application. Also, it offers no guarantees about restarting failed tasks either due to application failure or hardware failures. The Scheduler performs its scheduling function based the resource requirements of the applications; it does so based on the abstract notion of a resource Container which incorporates elements such as memory, CPU, disk, network etc. In the first version, only memory is supported.
  • The ApplicationsManager is responsible for accepting job-submissions, negotiating the first container for executing the application specific ApplicationMaster and provides the service for restarting the ApplicationMaster container on failure.

With the advent of YARN, you are no longer constrained by the simpler MapReduce paradigm of development, but can instead create more complex distributed applications. In fact, you can think of the MapReduce model as simply one more application in the set of possible applications that the YARN architecture can run, in effect exposing more of the underlying framework for customized development.

MRV2 maintains API compatibility with previous stable release (hadoop-1.x). This means that all Map-Reduce jobs should still run unchanged on top of MRv2 with just a recompile.

So how do I configure my YARN cluster settings\size my cluster correctly?

YARN configuration options are stored in the /opt/mapr/hadoop/hadoop-2.x.x/etc/hadoop/yarn-site.xml file and are editable by the root user. This file contains configuration information that overrides the default values for YARN parameters. Overrides of the default values for core configuration properties are stored in the yarn-default.xml file.

Common parameters for yarn-site.xml can be found here – http://doc.mapr.com/display/MapR/yarn-site.xml

There is a nice reference from Hortonworks here that talks about a tool that gives some best practice suggestions for memory settings and also goes over how to manually set these values, good article from Cloudera as well – http://www.cloudera.com/content/cloudera/en/documentation/cdh4/v4-2-2/CDH4-Installation-Guide/cdh4ig_topic_11_4.html

For more on YARN see – http://hortonworks.com/blog/apache-hadoop-yarn-hdp-2-2-substantial-step-forward-enterprise-hadoop/, http://blog.sequenceiq.com/blog/2014/07/22/schedulers-part-1/, http://docs.hortonworks.com/HDPDocuments/HDP2/HDP-2.0.6.0/bk_installing_manually_book/content/rpm_chap3.html, http://blogs.msdn.com/b/bigdatasupport/archive/2014/11/11/some-commonly-used-yarn-memory-settings.aspx , http://www.informit.com/articles/article.aspx?p=2190194&seqNum=2, http://arturmkrtchyan.com/how-to-setup-multi-node-hadoop-2-yarn-cluster

Dominus Anulorum – Troubleshooting SQL Server Connectivity Via Ring Buffers

Recently one of my customers ran into some challenges with intermittent connectivity failures from application to SQL Server data store\backend. In scenarios such as this the SQL Server Error Log is your friend, as it can be configured to record failed login attempts for an instance, however there is another useful tool – a lesser known SQL DMV sys.dm_os_ring_buffers.

ring_buffer_1

Note that you use this particular DMV at your own peril considering Books Online states that:

“The following SQL Server Operating System–related dynamic management views are Identified for informational purposes only. Not supported. Future compatibility is not guaranteed.”

In other words don’t go making use of this DMV as an integral part of your monitoring solution but rather be mindful of it’s existence as a possible tool for ad-hoc use.The DMV sys.dm_os_ring_buffers maintains approximately 1000 records, before wrapping around and replacing the oldest entries first. It exposes four columns but we’re primarily only interested in one of them, record, which contains XML data. There is lots of data there there, it can be used to look at CPU, memory, etc.; but in my case I will filter by connectivity ring buffer to look at connectivity issues:

SELECT CAST(record as xml) AS record_data
FROM sys.dm_os_ring_buffers
WHERE ring_buffer_type= 'RING_BUFFER_CONNECTIVITY'

Executing the statement above will produce output similar to the following:

Ring_Buffer_Connectivity

Clicking an XML fragment hyperlink will open the contents into a more readable format in a new tab in SSMS for you similar to below, showing a basic ring buffer connectivity error record. Fields that will be interesting to you in particular:

  • SniConsumerError – Error number that SNI consumer was sent
  • RemoteHost  – Remote Host responsible for connection

This of course isn’t really handy, as no one can look at 1000 XML records to find “needle in a haystack”. Therefore we need a query:

SELECT a.* FROM
(SELECT
x.value('(//Record/ConnectivityTraceRecord/RecordType)[1]', 'varchar(30)') AS [RecordType], 
x.value('(//Record/ConnectivityTraceRecord/RecordSource)[1]', 'varchar(30)') AS [RecordSource], 
x.value('(//Record/ConnectivityTraceRecord/Spid)[1]', 'int') AS [Spid], 
x.value('(//Record/ConnectivityTraceRecord/OSError)[1]', 'int') AS [OSError], 
x.value('(//Record/ConnectivityTraceRecord/SniConsumerError)[1]', 'int') AS [SniConsumerError], 
x.value('(//Record/ConnectivityTraceRecord/State)[1]', 'int') AS [State], 
x.value('(//Record/ConnectivityTraceRecord/RecordTime)[1]', 'nvarchar(30)') AS [RecordTime],
x.value('(//Record/ConnectivityTraceRecord/TdsBuffersInformation/TdsInputBufferError)[1]', 'int') AS [TdsInputBufferError],
x.value('(//Record/ConnectivityTraceRecord/TdsBuffersInformation/TdsOutputBufferError)[1]', 'int') AS [TdsOutputBufferError],
x.value('(//Record/ConnectivityTraceRecord/TdsBuffersInformation/TdsInputBufferBytes)[1]', 'int') AS [TdsInputBufferBytes],
x.value('(//Record/ConnectivityTraceRecord/TdsDisconnectFlags/PhysicalConnectionIsKilled)[1]', 'int') AS [PhysicalConnectionIsKilled],
x.value('(//Record/ConnectivityTraceRecord/TdsDisconnectFlags/DisconnectDueToReadError)[1]', 'int') AS [DisconnectDueToReadError],
x.value('(//Record/ConnectivityTraceRecord/TdsDisconnectFlags/NetworkErrorFoundInInputStream)[1]', 'int') AS [NetworkErrorFoundInInputStream],
x.value('(//Record/ConnectivityTraceRecord/TdsDisconnectFlags/ErrorFoundBeforeLogin)[1]', 'int') AS [ErrorFoundBeforeLogin],
x.value('(//Record/ConnectivityTraceRecord/TdsDisconnectFlags/SessionIsKilled)[1]', 'int') AS [SessionIsKilled],
x.value('(//Record/ConnectivityTraceRecord/TdsDisconnectFlags/NormalDisconnect)[1]', 'int') AS [NormalDisconnect]
FROM (SELECT CAST (record as xml) FROM sys.dm_os_ring_buffers 
WHERE ring_buffer_type = 'RING_BUFFER_CONNECTIVITY') AS R(x)) a
where a.RecordType = 'Error'
order by a.recordtime

But what if we have an issue not with network connectivity per se, but login timeouts. A login timers filter will be more useful in this case with query like this:

SELECT a.* FROM
(SELECT
x.value('(//Record/ConnectivityTraceRecord/RecordType)[1]', 'varchar(30)') AS [RecordType], 
x.value('(//Record/ConnectivityTraceRecord/RecordSource)[1]', 'varchar(30)') AS [RecordSource], 
x.value('(//Record/ConnectivityTraceRecord/Spid)[1]', 'int') AS [Spid], 
x.value('(//Record/ConnectivityTraceRecord/OSError)[1]', 'int') AS [OSError], 
x.value('(//Record/ConnectivityTraceRecord/SniConsumerError)[1]', 'int') AS [SniConsumerError], 
x.value('(//Record/ConnectivityTraceRecord/State)[1]', 'int') AS [State], 
x.value('(//Record/ConnectivityTraceRecord/RecordTime)[1]', 'nvarchar(30)') AS [RecordTime],
x.value('(//Record/ConnectivityTraceRecord/TdsBuffersInformation/TdsInputBufferError)[1]', 'int') AS [TdsInputBufferError],
x.value('(//Record/ConnectivityTraceRecord/TdsBuffersInformation/TdsOutputBufferError)[1]', 'int') AS [TdsOutputBufferError],
x.value('(//Record/ConnectivityTraceRecord/TdsBuffersInformation/TdsInputBufferBytes)[1]', 'int') AS [TdsInputBufferBytes],
x.value('(//Record/ConnectivityTraceRecord/LoginTimers/TotalLoginTimeInMilliseconds)[1]', 'int') AS [TotalLoginTimeInMilliseconds],
x.value('(//Record/ConnectivityTraceRecord/LoginTimers/LoginTaskEnqueuedInMilliseconds)[1]', 'int') AS [LoginTaskEnqueuedInMilliseconds],
x.value('(//Record/ConnectivityTraceRecord/LoginTimers/NetworkWritesInMilliseconds)[1]', 'int') AS [NetworkWritesInMilliseconds],
x.value('(//Record/ConnectivityTraceRecord/LoginTimers/NetworkReadsInMilliseconds)[1]', 'int') AS [NetworkReadsInMilliseconds],
x.value('(//Record/ConnectivityTraceRecord/LoginTimers/SslProcessingInMilliseconds)[1]', 'int') AS [SslProcessingInMilliseconds],
x.value('(//Record/ConnectivityTraceRecord/LoginTimers/SspiProcessingInMilliseconds)[1]', 'int') AS [SspiProcessingInMilliseconds],
x.value('(//Record/ConnectivityTraceRecord/LoginTimers/LoginTriggerAndResourceGovernorProcessingInMilliseconds)[1]', 'int') AS [LoginTriggerAndResourceGovernorProcessingInMilliseconds]
FROM (SELECT CAST (record as xml) FROM sys.dm_os_ring_buffers 
WHERE ring_buffer_type = 'RING_BUFFER_CONNECTIVITY') AS R(x)) a
where a.RecordType = 'LoginTimers'
order by a.recordtime 

What if logins don’t timeout, but user cannot login due to permissions. Lets filter than by security ring buffer:

  
SELECT CONVERT (varchar(30), GETDATE(), 121) as [RunTime],
dateadd (ms, rbf.[timestamp] - tme.ms_ticks, GETDATE()) as [Notification_Time],
cast(record as xml).value('(//SPID)[1]', 'bigint') as SPID,
cast(record as xml).value('(//ErrorCode)[1]', 'varchar(255)') as Error_Code,
cast(record as xml).value('(//CallingAPIName)[1]', 'varchar(255)') as [CallingAPIName],
cast(record as xml).value('(//APIName)[1]', 'varchar(255)') as [APIName],
cast(record as xml).value('(//Record/@id)[1]', 'bigint') AS [Record Id],
cast(record as xml).value('(//Record/@type)[1]', 'varchar(30)') AS [Type],
cast(record as xml).value('(//Record/@time)[1]', 'bigint') AS [Record Time],tme.ms_ticks as [Current Time]
from sys.dm_os_ring_buffers rbf
cross join sys.dm_os_sys_info tme
where rbf.ring_buffer_type = 'RING_BUFFER_SECURITY_ERROR'
ORDER BY rbf.timestamp ASC

So, as you can see this DMV can rather useful tool for DBA, as connectivity errors are hard to troubleshoot many times in today’s complex production environments.

For more on sys.dm_os_ring_buffers see – http://thesqldude.com/2012/01/31/sql-server-ring-buffers-and-the-fellowship-of-the-ring/, http://troubleshootingsql.com/tag/ring-buffers/, and https://bwunder.wordpress.com/2012/07/29/monitoring-and-troubleshooting-with-sys-dm_os_ring_buffers/