Using nmnon To Monitor Linux System Performance On Azure

Nmon (Nigel’s performance Monitor for Linux) is another very useful command line utility that can display information about various system resources like cpu, memory, disk, network etc. It was developed at IBM and later released open source.  It works on Linux, IBM AIX Unix, Power, x86, amd64 and ARM based system such as Raspberry Pi.

Here I will actually show you this utility and how it works by running it on Linux VM in Microsoft Azure. Why Azure? Because I can spin up VM, run tool on it and destroy it when not needed vs. creating a separate VM for Hyper-V or VirtualBox.

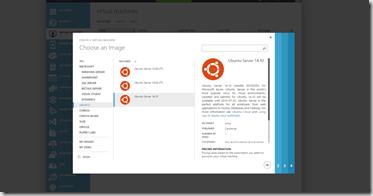
Creating Ubuntu Linux VM is deceptively simple in Azure. Just login into portal, pick Ubuntu from Virtual Machine Gallery and here you go:

image

However, there is one thing… You will need an SSH certificate to connect to your Linux VM, therefore Azure expects you to have one when you create your VM. To do that I had to install Cygwin and follow directions from here – http://azure.microsoft.com/en-us/documentation/articles/virtual-machines-linux-use-ssh-key/

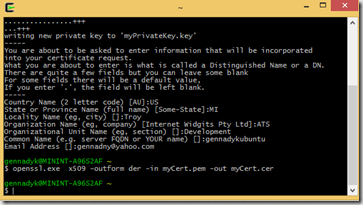
Using Cygwin you should be able to generate key and then certificate after (.cer file)

image

To be fair I did attempt to use OpenSSL for Windows to do same first, but Cygwin ended up a lot easier.

Once VM is created you will still need to download Putty to get to it – http://www.chiark.greenend.org.uk/~sgtatham/putty/download.html

Puttygen may not be able to read the private key that was created earlier (myPrivateKey.key). Run the following command to translate it into an RSA private key that Puttygen can understand:

image

Now lets import that key into Puttygen. I am still following instructions from Azure doc link above. Now I will run PuTTY and attempt to connect to IP of my Ubuntu Azure role that I got from Azure

linuxputtyconfig

Next also add your key

linuxputtyprivatekey

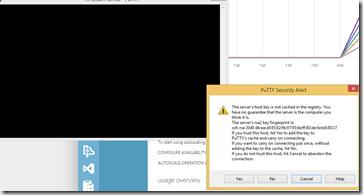
Next get this warning:

image

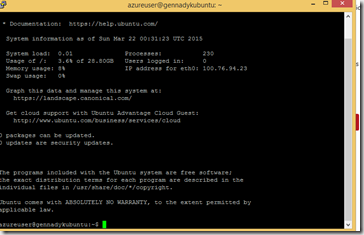
Finally I can connect:

image

Next I am going to make sure all my packages are up to date via

sudo apt-get update

Next I will install nmon.  That can be done via:

sudo apt-get install nmon

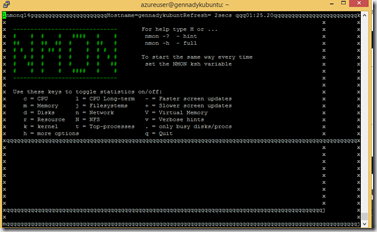
Once the installation of nmon has been finished and you launch it from the terminal by typing the ‘nmon‘ command you will be presented with the following output.

image

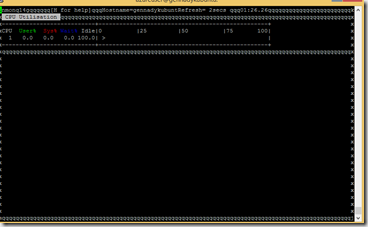
For example, if you would like to collect some statistics on CPU performance you should hit the ‘c‘ key on the keyboard of the system you are using. After hitting the ‘c‘ key on my keyboard I get a very nice output that gives me information on my CPU usage.

image

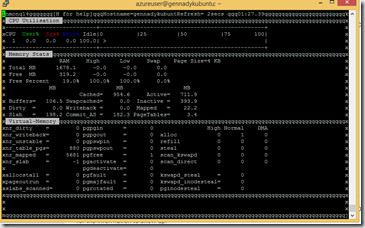
Lets add memory by hitting ‘m’ and virtual memory by hitting ‘V’

image

The following are the keys you can use with the  utility to get information on other system resources present in your machine.

  1. m = Memory
  2. j = Filesystems
  3. d = Disks
  4. n = Network
  5. V = Virtual Memory
  6. r = Resource
  7. N = NFS
  8. k = kernel
  9. t = Top-processes
  10. . = only busy disks/procs

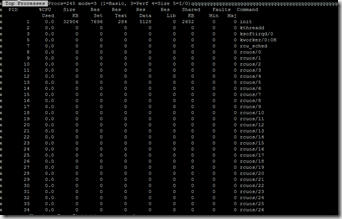
I can get stats on top processes running on my Linux system by using ‘t’

image

Of course there are other utilities you can use to troubleshoot and monitor Linux, but overall I find nmon really the easiest. If you are running systems like Java on Linux in Azure make sure you use this utility in conjunction with JVM troubleshooting tools such as jstack and  jmap and jhat, as I described previously.

For more see – http://www.cyberciti.biz/faq/nmon-performance-analyzer-linux-server-tool/, http://www.tecmint.com/nmon-analyze-and-monitor-linux-system-performance/, http://www.binarytides.com/nmon-linux-system-monitor/

Happy troubleshooting…

Meet Redis-Monitoring Redis Performance Metrics

redis

In my previous series on Redis I showed basic Redis tutorial,its abilities to work with complex data types, persist and scale out.  In this post idea is to show basic Redis monitoring facilities through Redis CLI. To analyze the Redis metrics you will need to access the actual data.Redis metrics are accessible through the Redis command line interface(redis-cli). So first I will start my MSOpenTech Redis on Windows Server. As I ran into an issue with default memory mapped file being to large for disk space on my laptop , I will feed it on start up configuration file (conf) which has maxmemory parameter cut to 256 MB. Otherwise I would get an error like:

The Windows version of Redis allocates a large memory mapped file for sharing
he heap with the forked process used in persistence operations. This file
ill be created in the current working directory or the directory specified by
he ‘heapdir’ directive in the .conf file. Windows is reporting that there is
insufficient disk space available for this file (Windows error 0x70).

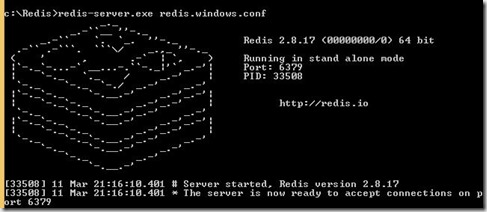
Since I changed maxmemory parameter, but not maxheap parameter which stayed at default 1.5 times maxmemory , my maxheap will be 384 MB (256*1.5).  I do have that much disk space on my laptop for memory mapped file.  As Redis starts I see now familiar screen:

redis_start

Now I can navigate to CLI.

redis_cli

We will use info command to print important information and metrics on our Redis Server. You can use info command to get information on following:

  • server
  • clients
  • memory
  • persistence
  • stats
  • replication
  • cpu
  • commandstats
  • cluster
  • keyspace

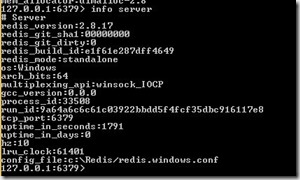
So lets start by getting general information by running info server

redis_info_server

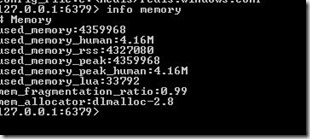
With Redis info memory will probably be one of most useful commands.  Here is me running it:

redis_info_memory

The used_memory metric reports the total number of bytes allocated by Redis. The used_memory_human metric gives the same value in a more readable format.

These metrics reflect the amount of memory that Redis has requested to store your data and the supporting metadata it needs to run. Due to the way memory allocators interact with underlying OS metrics don’t account for memory “lost” due to memory fragmentation and amount of memory reported by this metric may always differ from what is reported by OS.

Memory is critical to Redis performance. If amount of memory used exceeds available memory (used_memory metric>total available memory) the OS will begin swapping and older\unused memory pages will be written to disk to make room for newer\more used memory pages.  Writing or reading from disk is of course much slower that reading\writing to memory and this will have profound effect on Redis performance. By looking at used_memory metric together with OS metrics we can tell if instance is at risk of swapping or swapping has began.

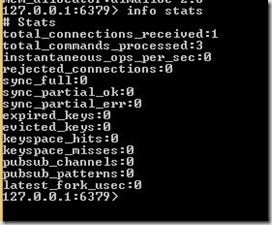
Next we can get some useful statistics by running info stats

redis_info_stats

The total_commands_processed metric gives the number of commands processed by the Redis server. These commands come from clients connected to Redis Server. Each time Redis completes one of 140 possible commands this metric (total_commands_processed)  is incremented. This can be used to do certain measurement of throughput and queuing discovery , if by repeatedly querying this metric (via automated batch or script for example) you see slowdowns and spikes in total_commands_processed this may indicated queuing.

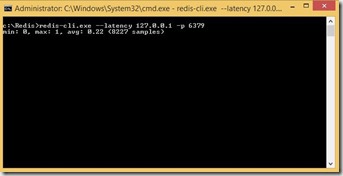
Note that none of these commands really measure latency to server. I found out that there is a way to measure it in Redis CLI. If you open separate command window, navigate to you Redis directory and run redis-cli.exe –latency –h <server>  -p <port> you can get that metric:

redis_latency

The times will depend on your actual setup, but I have read that on typical 1 Gbits/Sec network it should average well under 200 ms. Anything above probably point to an issue.

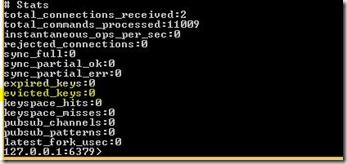
Back to stats another important metric is evicted_keys. This is similar to other alike systems such as AppFabric Cache where I profiled similar metric before. The evicted_keys metric gives the number of keys removed by Redis due to hitting the maxmemory limit. Interesting if you don’t set that limit evictions do not occur, but instead you may see something worse such as swapping and running out of memory. This of evictions therefore as protection mechanism here.  Interesting that when encountering memory pressure and electing to evict, Redis doesn’t necessarily evict oldest item. Instead it relies either on LRU (Least Recently Used) or TTL (Time to Live) cache policies.  You have the option to select between the LRU and TTL eviction policies in the config file by setting maxmemory-policy tovolatile-lru or “volatile-ttl respectively. If you are using Redis as in-memory cache server with expiring keys setting up TTL makes more sense, otherwise if you are using it with non-expiring keys you will probably choose LRU.

redis_info_stats_ek

For more information on info command see – http://www.redis.io/commands/info, http://www.lzone.de/Most%20Important%20Redis%20Commands%20for%20Sysadmins.

Save Our Souls – Troubleshooting Handle Leak with Application Verifier and WinDBG !htrace facilities

Handles are data structures that represent open instances of basic operating system objects applications interact with, such as files, registry keys, synchronization primitives, and shared memory. There are two limits related to the number of handles a process can create: the maximum number of handles the system sets for a process and the amount of memory available to store the handles and the objects the application is referencing with its handles.  Usually, your application process should never reach these fairly high limits, however there are times where application’s misuse of handles or failure to release resources (handle leak) may cause issues, sometimes as bad as pool errors 2019 or 2020 in OS that are profiled in this post in NTDebugging blog here – http://blogs.msdn.com/b/ntdebugging/archive/2006/12/18/understanding-pool-consumption-and-event-id_3a00_–2020-or-2019.aspx

handles

So, as we will need to leak handles before we can troubleshoot I will; create a C++ console application named LeakHandles to do so.  There isn’t anything complex I need to do here is create a handle that we don’t close

:

// LeakHandles.cpp : Defines the entry point for the console application.
//

#include "stdafx.h"
#include 


void Leak1(void);
void Leak2(void);
void Leak3(void);
void Leak4(void);
int _tmain(int argc, _TCHAR* argv[])
{
	while (1)
	{
		Leak1();
		Leak2();
		Sleep(100);
	}
	return 0;
}

void Leak1(void)

{

	Leak3();

}


void Leak2(void)

{

	Leak4();


}
void Leak3(void)

{

	HANDLE hEvent;


	hEvent = CreateEvent(NULL, TRUE, TRUE, NULL);

	CloseHandle(hEvent);

}
//here we will leak handle
void Leak4(void)

{

	HANDLE hEvent2;


	hEvent2 = CreateEvent(NULL, TRUE, TRUE, NULL);

}

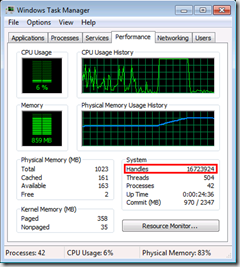
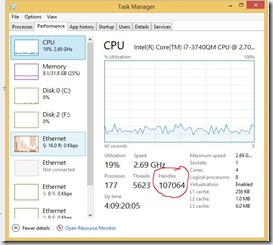
Now I will build my LeakHandles little application and lets run resulting LeakHandles.exe. Easy way to see that above leak is working is simply open Task Manager and watch handles in CPU area of Performance tab – with only LeakHandles active my handles are increasing really quick.

handles2

Next step that we do have an issue lets troubleshoot it. As I introduced you to AppVerifier in my previous post, I will not go deep on what is that tool and where you get it. Just to summarize – Application Verifier is a runtime verification tool for native code that assists in finding subtle programming errors that can be difficult to identify with normal application testing. Its now bundled as part of Windows SDK , so you can install it from – https://msdn.microsoft.com/en-us/windows/desktop/hh852363.aspx. Choose appropriate processor architecture for your system (x86 or x64).

After you download tools and install these on affected machine running culprit application we will need to setup Verifier rules. By activating Application Verifier, stack trace information is saved each time the process opens a handle, closes a handle, or references an invalid handle.

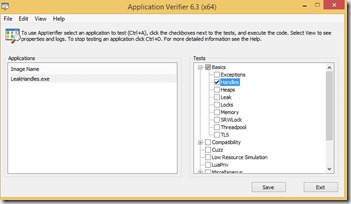
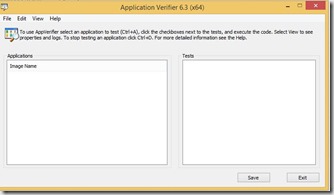
Open Verifier , then use File –>Add Application and pick culprit application from the browse dialog. In the right pane (Tests) pick Basics and make sure Handles are checked.  You should have something like below:

appverifier_handles

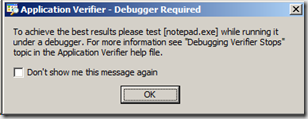
Click save and you will see this message:

message

That’s ok as I am planning to attach debugger to my process a bit later. Lets reopen Verifier again, just to make sure that our settings were properly saved into registry and we are still doing the right thing.  If we look good after extra check, lets close it again.

If your process is currently running, stop and restart the process.   If for example you are using IIS, you want to run iisreset at this point to restart IIS.  This step is required as the process reads the Application Verifier flags ONLY during startup.

In our case we are still working with my sample LeakHandles executable, so I will launch that now.

leakhandles

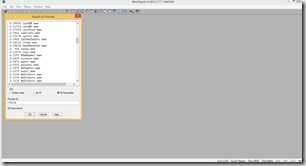
Now open WinDBG.exe (from Debugging Tools For Windows install).  Select File |-> Attach To Process. I will attach to my culprit exe non invasively:

handles_attach

Next after you successfully attached, run following:

0:000> !htrace -enable
Handle tracing enabled.
Handle tracing information snapshot successfully taken.

This extension,  !htrace extension displays stack trace information for one or more handles. When you provide –enable parameter for user mode process it enables handle tracing and takes the first snapshot of the handle information to use as the initial state by the -diff option.

Once I enabled I can exit debugger by using q – quit command.

Now we want to see what handle tracking can do for us.  Start WinDBG and attach to culprit process again same as above. Observe that since we attached previously in non-invasive mode, process didn’t exit as we detached, so we have same PID as before.  Next after we attached we will generate a nice memory dump like below:

0:000> .dump /ma f:\leakdump.dmp
Creating f:\leakdump.dmp - mini user dump
Dump successfully written

I ill quit again to exit debugger. Now I will open my dump in the debugger. Remember to make sure your symbol path is setup correctly – https://msdn.microsoft.com/en-us/library/windows/hardware/ff558829(v=vs.85).aspx. If your symbols are set correctly as you open dump there will be a bit of a pause as symbols are downloaded to your local downstream symbol store.  Next in my case as LeakHandles.exe is 32 bit process running in 64 bit Windows under WoW (Windows on Windows) and I am in 64 bit WinDBG I will need to use wow64exts  extension to switch to 32 bit stacks. If you are debugging 32 bit on 32 bit or 64 bit native you don’t need this step at all.

0:000> !wow64exts.sw
Switched to 32bit mode

Now we want to see a trace of our handle activity, run the !htrace command with no arguments:

!htrace

Next you will see tons of debugger spew like below:

--------------------------------------
Handle = 0x0000000000002b9c - OPEN
Thread ID = 0x000000000000700c, Process ID = 0x0000000000008b28

0x00007fff5959125a: ntdll!ZwCreateEvent+0x000000000000000a
0x0000000000f06750: verifier!AVrfpNtCreateEvent+0x0000000000000080
0x000000007777a032: wow64!whNtCreateEvent+0x0000000000000062
0x000000007777a44b: wow64!Wow64SystemServiceEx+0x00000000000000fb
0x00000000777c1dc5: wow64cpu!TurboDispatchJumpAddressEnd+0x000000000000000b
0x000000007778219a: wow64!RunCpuSimulation+0x000000000000000a
0x00000000777820d2: wow64!Wow64LdrpInitialize+0x0000000000000172
0x00007fff595c3d39: ntdll!LdrpInitializeProcess+0x0000000000001591
0x00007fff595a379e: ntdll!_LdrpInitialize+0x0000000000087d2e
0x00007fff5951ba1e: ntdll!LdrInitializeThunk+0x000000000000000e
0x000000007780cafc: ntdll_777d0000!ZwCreateEvent+0x000000000000000c
0x000000000ffd510c: vfbasics+0x000000000001510c
0x00000000753b221a: KERNELBASE!CreateEventExW+0x000000000000006a
0x00000000753b2288: KERNELBASE!CreateEventW+0x0000000000000028

This shows you all the handle activity in the process.

You can locate a double close by searching for the CLOSE lines:

Handle = 0x000000000000033c – CLOSE

This will also have the stack trace of the code that closed the handle.

In our case LeakHandles had one function Leak3 that properly close handle and that can be confirmed from !htrace output:

--------------------------------------
Handle = 0x0000000000002b9c - CLOSE
Thread ID = 0x000000000000700c, Process ID = 0x0000000000008b28

0x00000000777c2352: wow64cpu!TurboDispatchJumpAddressEnd+0x0000000000000598
0x00000000777c2318: wow64cpu!TurboDispatchJumpAddressEnd+0x000000000000055e
0x000000007778219a: wow64!RunCpuSimulation+0x000000000000000a
0x00000000777820d2: wow64!Wow64LdrpInitialize+0x0000000000000172
0x00007fff595c3d39: ntdll!LdrpInitializeProcess+0x0000000000001591
0x00007fff595a379e: ntdll!_LdrpInitialize+0x0000000000087d2e
0x00007fff5951ba1e: ntdll!LdrInitializeThunk+0x000000000000000e
0x000000007780c76c: ntdll_777d0000!NtClose+0x000000000000000c
0x000000000ffd52e6: vfbasics+0x00000000000152e6
0x00000000753aef8a: KERNELBASE!CloseHandle+0x000000000000001a
0x000000000ffd6327: vfbasics+0x0000000000016327
0x000000000ffd63ae: vfbasics+0x00000000000163ae
0x000000000ffd6327: vfbasics+0x0000000000016327
0x000000000ffd638d: vfbasics+0x000000000001638d
0x00000000001914d4: LeakHandles!Leak3+0x0000000000000044

But I also see lots of open handles like

Handle = 0x000000000000361c - OPEN
Thread ID = 0x000000000000700c, Process ID = 0x0000000000008b28

0x00000000777c2352: wow64cpu!TurboDispatchJumpAddressEnd+0x0000000000000598
0x00000000777c2318: wow64cpu!TurboDispatchJumpAddressEnd+0x000000000000055e
0x000000007778219a: wow64!RunCpuSimulation+0x000000000000000a
0x00000000777820d2: wow64!Wow64LdrpInitialize+0x0000000000000172
0x00007fff595c3d39: ntdll!LdrpInitializeProcess+0x0000000000001591
0x00007fff595a379e: ntdll!_LdrpInitialize+0x0000000000087d2e
0x00007fff5951ba1e: ntdll!LdrInitializeThunk+0x000000000000000e
0x000000007780c76c: ntdll_777d0000!NtClose+0x000000000000000c
0x000000000ffd52e6: vfbasics+0x00000000000152e6
0x00000000753aef8a: KERNELBASE!CloseHandle+0x000000000000001a
0x000000000ffd6327: vfbasics+0x0000000000016327
0x000000000ffd63ae: vfbasics+0x00000000000163ae
0x000000000ffd6327: vfbasics+0x0000000000016327
0x000000000ffd638d: vfbasics+0x000000000001638d
0x00000000001914d4: LeakHandles!Leak4+0x0000000000000044
--------------------------------------

Well, I suppose we got what we were looking for here. Next, be absolutely sure to start App Verifier again and delete the process entry for your process!  You want to always do this since the App Verifier settings are persisted in the registry, they will survive even a server reboot.  Right click on the Image Name and select “Delete Application”.  Then click Save and close and re-open App Verifier to ensure that the entry is gone. As well if you are debugging some service you want to restart the service to stop the tracking, run iisreset for example again to reset IIS to normal state if you are debugging IIS. I will open Application Verifier , Delete Application and Save. At the end you should have clean Application Verifier window like:

cleanappverifier

Happy handle hunting!.

For more see –http://blogs.technet.com/b/markrussinovich/archive/2009/09/29/3283844.aspx, https://msdn.microsoft.com/en-us/library/ms220948(v=vs.90).aspx, http://blogs.technet.com/b/yongrhee/archive/2011/12/19/how-to-troubleshoot-a-handle-leak.aspx, http://blogs.msdn.com/b/junfeng/archive/2008/04/21/use-htrace-to-debug-handle-leak.aspx, http://blogs.technet.com/b/brad_rutkowski/archive/2007/11/13/got-a-handle-leak-use-htrace-to-help-find-the-leaking-stacks-non-invasively.aspx, http://stackoverflow.com/questions/7617256/how-do-i-diagnose-a-handle-leak, http://www.asprangers.com/post/2012/01/23/How-to-Debug-Handle-leak-(using-!htrace)-in-w3wpexe.aspx, http://blogs.msdn.com/b/ntdebugging/archive/2006/12/18/understanding-pool-consumption-and-event-id_3a00_–2020-or-2019.aspx.

Hope this helps.

Dancing With Elephants – Hadoop: Introduction to Basics of HDFS

Its been some time now that I have been fascinated by Hadoop and its related technologies. Coming from SQL Server and RDBMS background topic of analytics or what is now called “Big Data” is near and dear to my heart

Almost everywhere you go online now, Hadoop is there in some capacity. Facebook, eBay, Etsy, Yelp , Twitter, Salesforce.com — you name a popular web site or service, and the chances are it’s using Hadoop to analyze the mountains of data it’s generating about user behavior and even its own operations. Even in the physical world, forward-thinking companies in fields ranging from entertainment to energy management to satellite imagery are using Hadoop to analyze the unique types of data they’re collecting and generating.

When the seeds of Hadoop were first planted in 2002, the world just wanted a better open-source search engine. So then-Internet Archive search director Doug Cutting and University of Washington graduate student Mike Cafarella set out to build it. They called their project Nutch and it was designed with that era’s web in mind.

Google released the Google File System paper in October 2003 and the MapReduce paper in December 2004. The latter would prove especially revelatory to the two engineers building Nutch.

What they spent a lot of time doing was generalizing this into a framework that automated all these steps that we were doing manually,” Cutting explained. In 2006, Cutting went to work with Yahoo, which was equally impressed by the Google File System and MapReduce papers and wanted to build open source technologies based on them. They spun out the storage and processing parts of Nutch to form Hadoop (named after Cutting’s son’s stuffed elephant) as an open-source Apache Software Foundation project and the Nutch web crawler remained its own separate project.

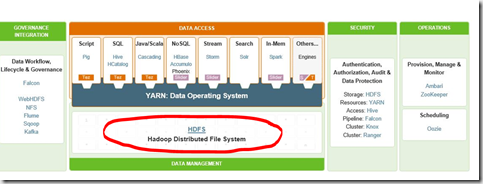
So from Google File System paper grew foundation of all Hadoop – HDFS. The Hadoop Distributed File System (HDFS) is a distributed file system designed to run on commodity hardware. It has many similarities with existing distributed file systems. However, the differences from other distributed file systems are significant. HDFS is highly fault-tolerant and is designed to be deployed on low-cost hardware. HDFS provides high throughput access to application data and is suitable for applications that have large data sets. HDFS relaxes a few POSIX requirements to enable streaming access to file system data.
image

As you can see above – HDFS is foundation of all things Hadoop.  It was created with following assumptions in mind:

  • Accept idea that hardware fails. Hardware failure is the norm rather than the exception. An HDFS instance may consist of hundreds or thousands of server machines, each storing part of the file system’s data. The fact that there are a huge number of components and that each component has a non-trivial probability of failure means that some component of HDFS is always non-functional. Therefore, detection of faults and quick, automatic recovery from them is a core architectural goal of HDFS.
  • Streaming Data Access. Applications that run on HDFS need streaming access to their data sets. They are not general purpose applications that typically run on general purpose file systems. HDFS is designed more for batch processing rather than interactive use by users. The emphasis is on high throughput of data access rather than low latency of data access. POSIX imposes many hard requirements that are not needed for applications that are targeted for HDFS. POSIX semantics in a few key areas has been traded to increase data throughput rates.
  • Work with very large data sets. Applications that run on HDFS have large data sets. A typical file in HDFS is gigabytes to terabytes in size. Thus, HDFS is tuned to support large files. It should provide high aggregate data bandwidth and scale to hundreds of nodes in a single cluster. It should support tens of millions of files in a single instance.
  • Write Once and Read Many Access. HDFS applications need a write-once-read-many access model for files. A file once created, written, and closed need not be changed. This assumption simplifies data coherency issues and enables high throughput data access. A MapReduce application or a web crawler application fits perfectly with this model. There is a plan to support appending-writes to files in the future.
  • Move computation, not data. A computation requested by an application is much more efficient if it is executed near the data it operates on. This is especially true when the size of the data set is huge. This minimizes network congestion and increases the overall throughput of the system. The assumption is that it is often better to migrate the computation closer to where the data is located rather than moving the data to where the application is running. HDFS provides interfaces for applications to move themselves closer to where the data is located.

So what is the architecture of HDFS?

HDFS has a master/slave architecture. An HDFS cluster consists of a single NameNode, a master server that manages the file system namespace and regulates access to files by clients. In addition, there are a number of DataNodes, usually one per node in the cluster, which manage storage attached to the nodes that they run on. HDFS exposes a file system namespace and allows user data to be stored in files. Internally, a file is split into one or more blocks and these blocks are stored in a set of DataNodes. The NameNode executes file system namespace operations like opening, closing, and renaming files and directories. It also determines the mapping of blocks to DataNodes. The DataNodes are responsible for serving read and write requests from the file system’s clients. The DataNodes also perform block creation, deletion, and replication upon instruction from the NameNode.  Typical workflow can be seen below:
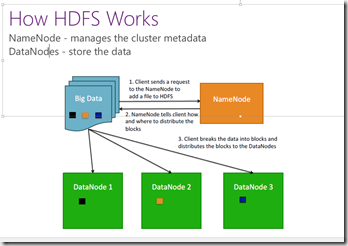
image

The NameNode and DataNode are pieces of software designed to run on commodity machines. These machines typically run a GNU/Linux operating system (OS). HDFS is built using the Java language; any machine that supports Java can run the NameNode or the DataNode software. Usage of the highly portable Java language means that HDFS can be deployed on a wide range of machines. A typical deployment has a dedicated machine that runs only the NameNode software. Each of the other machines in the cluster runs one instance of the DataNode software.

What’s so special with HDFS ? – Data Replication.

HDFS is designed to reliably store very large files across machines in a large cluster. It stores each file as a sequence of blocks; all blocks in a file except the last block are the same size. The blocks of a file are replicated for fault tolerance. The block size and replication factor are configurable per file. An application can specify the number of replicas of a file. The replication factor can be specified at file creation time and can be changed later. Files in HDFS are write-once and have strictly one writer at any time.

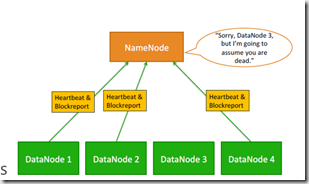
The NameNode makes all decisions regarding replication of blocks. It periodically receives a Heartbeat and a Blockreport from each of the DataNodes in the cluster. Receipt of a Heartbeat implies that the DataNode is functioning properly. A Blockreport contains a list of all blocks on a DataNode.

What’s so special with HDFS? – Heartbeat.

One important objective of HDFS is to store data reliably, even when failures occur within name nodes, data nodes, or network partitions.  Detection is the first step HDFS takes to overcome failures. HDFS uses heartbeat messages to detect connectivity between name and data nodes. Several things can cause loss of connectivity between name and data nodes. Therefore, each data node sends periodic heartbeat messages to its name node, so the latter can detect loss of connectivity if it stops receiving them. The name node marks as dead data nodes not responding to heartbeats and refrains from sending further requests to them. Data stored on a dead node is no longer available to an HDFS client from that node, which is effectively removed from the system. If the death of a node causes the replication factor of data blocks to drop below their minimum value, the name node initiates additional replication to bring the replication factor back to a normalized state.
image

What is so special with HDFS ? – Replica Placement.

The placement of replicas is critical to HDFS reliability and performance. Optimizing replica placement distinguishes HDFS from most other distributed file systems. This is a feature that needs lots of tuning and experience. The purpose of a rack-aware replica placement policy is to improve data reliability, availability, and network bandwidth utilization. The current implementation for the replica placement policy is a first effort in this direction. The short-term goals of implementing this policy are to validate it on production systems, learn more about its behavior, and build a foundation to test and research more sophisticated policies.

For the common case, when the replication factor is three, HDFS’s placement policy is to put one replica on one node in the local rack, another on a node in a different (remote) rack, and the last on a different node in the same remote rack. This policy cuts the inter-rack write traffic which generally improves write performance. The chance of rack failure is far less than that of node failure; this policy does not impact data reliability and availability guarantees. However, it does reduce the aggregate network bandwidth used when reading data since a block is placed in only two unique racks rather than three. With this policy, the replicas of a file do not evenly distribute across the racks. One third of replicas are on one node, two thirds of replicas are on one rack, and the other third are evenly distributed across the remaining racks. This policy improves write performance without compromising data reliability or read performance.

This is all great – what happens on DataNode disk failure?

Each DataNode sends a Heartbeat message to the NameNode periodically. A network partition can cause a subset of DataNodes to lose connectivity with the NameNode. The NameNode detects this condition by the absence of a Heartbeat message. The NameNode marks DataNodes without recent Heartbeats as dead and does not forward any new IO requests to them. Any data that was registered to a dead DataNode is not available to HDFS any more. DataNode death may cause the replication factor of some blocks to fall below their specified value. The NameNode constantly tracks which blocks need to be replicated and initiates replication whenever necessary. The necessity for re-replication may arise due to many reasons: a DataNode may become unavailable, a replica may become corrupted, a hard disk on a DataNode may fail, or the replication factor of a file may be increased.

What about metadata disk failure?

The FsImage and the EditLog are central data structures of HDFS. A corruption of these files can cause the HDFS instance to be non-functional. For this reason, the NameNode can be configured to support maintaining multiple copies of the FsImage and EditLog. Any update to either the FsImage or EditLog causes each of the FsImages and EditLogs to get updated synchronously. This synchronous updating of multiple copies of the FsImage and EditLog may degrade the rate of namespace transactions per second that a NameNode can support. However, this degradation is acceptable because even though HDFS applications are very data intensive in nature, they are not metadata intensive. When a NameNode restarts, it selects the latest consistent FsImage and EditLog to use.

Important to note – DataNodes can fail, but NameNode is a single point of failure in Hadoop 1.0

The NameNode machine is a single point of failure for an HDFS cluster. If the NameNode machine fails, manual intervention is necessary.The Hadoop 2.0 HDFS High Availability feature addresses the above problems by providing the option of running two redundant NameNodes in the same cluster in an Active/Passive configuration with a hot standby. This allows a fast failover to a new NameNode in the case that a machine crashes, or a graceful administrator-initiated failover for the purpose of planned maintenance.

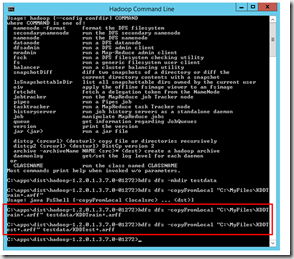
FSShell. HDFS allows user data to be organized in the form of files and directories. It provides a commandline interface called FS shell that lets a user interact with the data in HDFS. The syntax of this command set is similar to other shells (e.g. bash, csh) that users are already familiar with. Here are some sample action/command pairs:
image

Many of FSShell commands are pretty familiar mkdir to create directory, mv to move files, rm to delete files, etc.

Full docs on FSShell commands can be found here – http://hadoop.apache.org/docs/r2.2.0/hadoop-project-dist/hadoop-common/FileSystemShell.html

HDFS also has a Java based API.  Docs on that can be found here – http://hadoop.apache.org/docs/current/api/

This is lots of theory, but in the next few posts I hope that I show more practical things using Hive – a DW facilities on top of HDFS and Yarn that allow for querying\writing Hadoop jobs using SQL like language (HiveQL) using Hortonworks Sandbox.

More on HDFS as foundation of Hadoop – http://www.ibm.com/developerworks/library/wa-introhdfs/index.html, http://hortonworks.com/hadoop/hdfs/, http://hadoop.apache.org/docs/current/hadoop-project-dist/hadoop-hdfs/HdfsDesign.html, http://hortonworks.com/blog/ha-namenode-for-hdfs-with-hadoop-1-0-part-1/