Javacore Dump Analysis using JCA – IBM Thread and Monitor Dump Analyzer for Java

In my previous blog posts I spent some time in illustrating tools for thread analysis for Oracle\Sun HotSpot JVM. However recently I actually had to analyze stack\javacore dumps from IBM WebSphere for hang condition and therefore had to research equivalent tools to analyze dumps from that JVM.

As we all know, during the run time of a Java process, some Java Virtual Machines (JVMs) may not respond predictably and oftentimes seem to hang up for a long time or until JVM shutdown occurs. It is not easy to determine the root cause of these sorts of problems.

By triggering a javacore when a Java process does not respond, it is possible to collect diagnostic information related to the JVM and a Java application captured at a particular point during execution. For example, the information can be about the operating system, the application environment, threads, native stack, locks, and memory. The exact contents are dependent on the platform on which the application is running.

On non IBM platforms, and in most cases, javacore is known as “javadump.” Check out my previous post of how to analyze dumps on Oracle Sun JVM via jstack utility. The code that creates javacore is part of the JVM. One can control it by using environment variables and run-time switches. By default, a javacore occurs when the JVM terminates unexpectedly. A javacore can also be triggered by sending specific signals to the JVM. Although javacore or javadump is present in Sun JVMs, much of the content of the javacore is added by IBM and, therefore, is present only in IBM JVMs.

This technology analyzes each thread information and provides diagnostic information, such as current thread information, the signal that caused the javacore, Java heap information (maximum Java heap size, initial Java heap size, garbage collector counter, allocation failure counter, free Java heap size, and allocated Java heap size), number of runnable threads, total number of threads, number of monitors locked, and deadlock information.

You can download tool from here – https://www.ibm.com/developerworks/community/groups/service/html/communityview?communityUuid=2245aa39-fa5c-4475-b891-14c205f7333c.

Once the tool is downloaded, you can run jca.jar with the Java Run-time Environment

command_line_jca

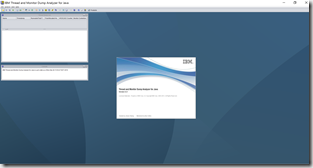
This will open up the tool

jca_splash

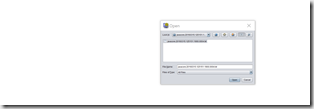
Let’s now use File-Open and open a javacore\dump file

jca_fileopen

The tool will show a screen with a progress bar while it loads the javacore. Clicking on the javacore you just loaded in the Thread Dump List

jca_afterfileopen

As you can see you get huge amount of JVM settings details, as well as If the tool detected a deadlock then it will be displayed in the lower section of the Thread Dump List

jca_summary

and

dead


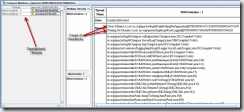
Selecting the Compare Monitors option from Analysis Menu will show deadlocked threads

jca_dead

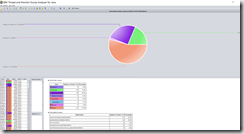
Another useful screen is Thread Status Screen. Here you can see RUNNABLE vs. PARKED vs. BLOCKED threads and associated stacks. This screen can be very useful in resolving slow response and hang conditions

jca_thread_status

A complete explanation of all thread states for Java 7 can be found here – https://www.ibm.com/support/knowledgecenter/SSYKE2_7.0.0/com.ibm.java.aix.71.doc/diag/tools/javadump_tags_threads.html. Once you locate the RUNNABLE threads that are executing your application code, find out which method is being executed by following the stack trace. You may get  assistance from development team if needed. Also note the Thread ID.

The following Thread in the example below is in BLOCK state which typically means it is waiting to acquire a lock on an Object monitor. You will need to search in the earlier section and determine which Thread is holding the lock so you can pinpoint the root cause.

3XMTHREADINFO      "[STUCK] ExecuteThread: '162' for queue: 'weblogic.kernel.Default (self-tuning)'" J9VMThread:0x000000013ACF0800, j9thread_t:0x000000013AC88B20, java/lang/Thread:0x070000001F945798, state:B, prio=1

3XMTHREADINFO1            (native thread ID:0x1AD0F3, native priority:0x1, native policy:UNKNOWN)

3XMTHREADINFO3           Java callstack:

4XESTACKTRACE                at org/springframework/jms/connection/SingleConnectionFactory.createConnection(SingleConnectionFactory.java:207(Compiled Code))

4XESTACKTRACE                at org/springframework/jms/connection/SingleConnectionFactory.createQueueConnection(SingleConnectionFactory.java:222(Compiled Code))

4XESTACKTRACE                at org/springframework/jms/core/JmsTemplate102.createConnection(JmsTemplate102.java:169(Compiled Code))

4XESTACKTRACE                at org/springframework/jms/core/JmsTemplate.execute(JmsTemplate.java:418(Compiled Code))

4XESTACKTRACE                at org/springframework/jms/core/JmsTemplate.send(JmsTemplate.java:475(Compiled Code))

4XESTACKTRACE                at org/springframework/jms/core/JmsTemplate.send(JmsTemplate.java:467(Compiled Code))

…………………………………………………………………………………………………………


Hope this helps. For more see – https://www.ibm.com/developerworks/community/groups/service/html/communityview?communityUuid=2245aa39-fa5c-4475-b891-14c205f7333c, https://www.ibm.com/developerworks/community/blogs/e8206aad-10e2-4c49-b00c-fee572815374/entry/Java_Core_Debugging_using_IBM_Thread_and_Monitor_Dump_Analyzer_for_Java?lang=en
Et Obscure Ex Alto–TDS Compatibility for SQL Server Upgrades

As majority of folks may know time is counting down on SQL Server extended support for SQL Server 2005 , it officially ends April 12, 2016. Working with folks on upgrading to fairly old systems from SQL Server 2000\2005 to newer versions like SQL Server 2012\2014 we ran into fairly rare issue of TDS backward compatibility, mainly with very old clients running older versions of JDBC\ODBC drivers.

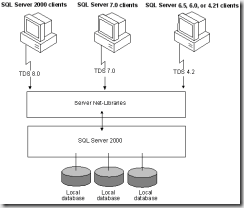
Tabular Data Stream (TDS) is an application layer protocol, used to transfer data between a database server and a client. It was initially designed and developed by Sybase Inc. for their Sybase SQL Server relational database engine in 1984, and later by Microsoft in Microsoft SQL Server

tds

Microsoft published TDS specification in 2008 – https://msdn.microsoft.com/en-us/library/cc448435.aspx , Still TDS and especially TDS compatibility on SQL Server upgrades are pretty obscure topic. Microsoft published TDS version list matched to SQL Server and .NET Framework here – https://msdn.microsoft.com/en-us/library/dd339982.aspx

TDS version SQL Server version .NET Framework version
7.0 SQL Server 7.0 .NET Framework 1.1
7.1 SQL Server 2000 .NET Framework 1.1
7.1 Revision 1 SQL Server 2000 SP1 .NET Framework 1.1
7.2 SQL Server 2005 .NET Framework 2.0
7.3.A SQL Server 2008 .NET Framework 4.0
7.3.B SQL Server 2008 R2 N/A
7.4 SQL Server 2012 .NET Framework 4.5
7.4 SQL Server 2014 .NET Framework 4.5
7.4 SQL Server 2016 CTP2 .NET Framework 4.6

Although TDS compatibility isn’t well documented by Microsoft , from what I have experienced it appears Microsoft keeps at least two versions of TDS backwardly compatible.

So how do I find out what versions of TDS are connecting to your server? On newer versions like SQL Server 2005 and above where DMVs are present following query can be used:

select protocol_type, protocol_version from sys.dm_exec_connections

Result will be something like:

TSQL   1930035203 

Well, the big number still doesn’t say which version of data access driver, does it? Actually it does. The integer value is the representation of TDS version (for TSQL). It needs to be translated as follows, converting protocol version to Hex:

SELECT CONVERT(BINARY(4), 1930035203) 

Result will be as follows:

0x730A0003

Take the first two hex digits (0x73) and map it to correct SQL Server version based on the table above. So now we know that connection was made via TDS 7.3x , possibly via SQL Server 2008 Client stack.

In one of its older posts SQLCAT actually combined al;l of these steps into one query:

SELECT session_id, protocol_type, driver_version = 
CASE SUBSTRING(CAST(protocol_version AS BINARY(4)), 1,1)
WHEN 0x70 THEN ‘SQL Server 7.0′
WHEN 0x71 THEN ‘SQL Server 2000′
WHEN 0x72 THEN ‘SQL Server 2005′
WHEN 0x73 THEN ‘SQL Server 2008′
ELSE ‘Unknown driver’
END
FROM sys.dm_exec_connections

But what if I am on SQL Server 2000, well before DMVs were available and need to check my TDS versions connecting before upgrade?

Here things will become a lot more difficult and labor intensive. The only way I think is via checking version in TDS pre-login packet via network capture on SQL Server side.

As per – https://msdn.microsoft.com/en-us/library/dd357559.aspx pre-login is message sent by the client to set up context for login. The server responds to a client PRELOGIN message with a message of packet header type 0x04 and the packet data containing a PRELOGIN structure. As part there is optional version value:

PL_OPTION_TOKEN Value Description
VERSION 0x00 PL_OPTION_DATA =   UL_VERSION

                   US_SUBBUILD

UL_VERSION is represented in network byte order (big-endian).

The server SHOULD use the VERSION sent by the client to the server. The client SHOULD use the version returned from the server to determine which features are enabled or disabled. The client SHOULD do this only if it is known that this feature is supported by that version of the database.<27>

Theoretically upon capture of such data via network trace it can be filtered in wireshark , from – https://www.wireshark.org/docs/dfref/t/tds.html

tds.prelogin.option.version	Version	Unsigned integer, 4 bytes	2.0.0

According to spec, version is an option – client should provide version by docs, however possibly some clients don’t. Assume that would be pretty rare, at least all mainstream clients I have seen do.

So dealing with older, obscure SQL Server clients is hard, but doesn’t have to impossible.

For more see – https://blogs.msdn.microsoft.com/jenss/2009/03/02/tds-protocol-versions-meet-client-stacks/, https://blogs.msdn.microsoft.com/sql_protocols/2008/07/15/connection-failure-because-of-mismatched-tds-version/, https://msdn.microsoft.com/en-us/library/dd339982.aspx