In my recent past as Field Engineer working with customers I had to deal with many managed applications that had performance and stability issues due to memory usage. With .NET 4 there were definitely big interesting additions introduced to memory management , but talking to customers I believe they may have drowned out in a see of tech announcements and many developers in the field simply do not remember these. Therefore here is some basic information on Garbage Collection flavors in .NET and some ways to troubleshoot GC issues for existing applications.
Workstation vs. Server GC
There are actually two different modes of garbage collection, which you can control using gcServer tag in the runtime configuration part of your config file. Workstation Garbage Collection is set by default. The gcServer configuration flag was introduced long ago , with .NET 2.0, and you can use it to control whether Workstation or Server GC is used on multi processor machines. With server GC, a thread for every core is created just for doing GC. There is also a small object heap and a large object heap created for each GC thread. All of the program’s allocations are spread among these heaps (more on large object heaps later). When no GC is happening, these threads are blocked and do nothing. When a GC is triggered, all of the user threads get paused, and all the GC threads wake up at highest priority and do collection in parallel. All of these optimizations lead to server GC usually being much faster than workstation GC.
So Server GC:
- Multiprocessor (MP) Scalable, Parallel
- One GC thread per CPU
- Program paused during marking
Workstation GC
- Great for UI driven apps as minimizes pausing during full GC collection
- Runs slower
Concurrent vs. Background
Now besides Server vs Workstation, there are Concurrent and Background operation modes. Both of them allow a second generation to be collected by a dedicated thread without pausing all user threads. Generation 0 and 1 require pausing all user threads, but they are always the fastest. This of course increases the level of responsiveness an application can deliver.
Concurrent Mode.
Default mode for Workstation GC and will provide a dedicated thread performing GC, even on multiprocessor machines. You can turn it off using gcConcurrent tag. This mode offers much shorter user threads pauses as the most time consuming Gen2 collection is done concurrently, on the cost of limited allocation capabilities during concurrent GC. While Gen2 collection takes place, other threads can only allocate up to the limit of current ephemeral segment, as it’s impossible to allocate new memory segment. If your process runs out of place in current segment, all threads will have to be paused anyway and wait for concurrent collection to finish. This is because Gen0 and Gen1 collections cannot be performed while concurrent GC is still in progress. Concurrent GC also has a slightly higher memory requirements.
Background Mode
Starting with .NET 4.5 this is actually default mode that replaces Concurrent. It’s also available for both Workstation and Server modes, while Concurrent was only available for Workstation. The big improvement being that Background mode can actually perform Gen0 and Gen1 collections while simultaneously performing Gen2 collection.
Workstation garbage collection can be:
- Concurrent
- Background
- Non-concurrent
while options for Server garbage collection are as follows:
- Background
- Non-concurrent
For more see – https://blogs.msdn.microsoft.com/tess/2009/05/29/background-garbage-collection-in-clr-4-0/, https://blogs.msdn.microsoft.com/dotnet/2012/07/20/the-net-framework-4-5-includes-new-garbage-collector-enhancements-for-client-and-server-apps/
So how do I collect my GC pause information to make decision on what mode is best for me?
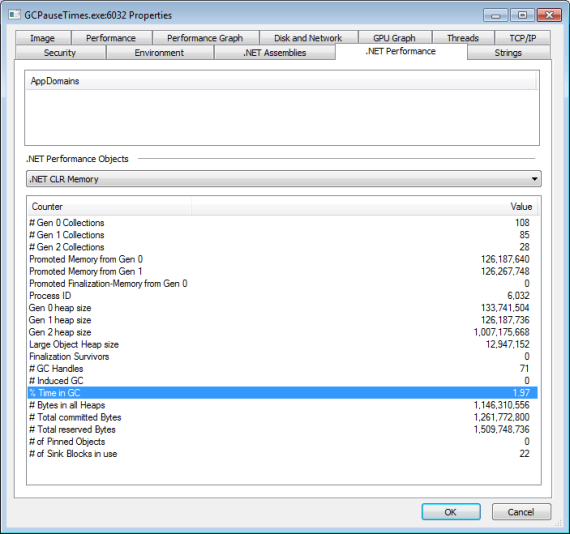
The first thing to do is take a look at the properties of the process using the excellent Process Explorer tool from Sysinternals (imagine Task Manager on steroids). It will give you a summary like the one below, the number of Gen 0/1/2 Collections and % Time in GC are the most interesting values to look at.

The other way to get very deep insight is grab an ETW trace as explained by Maoni Stephens here – https://blogs.msdn.microsoft.com/maoni/2014/12/22/gc-etw-events-1/, this is a method of looking into GC stats that I use utilizing pretty popular PerfView tool that works on top of Event Tracing for Windows (ETW). Another good tutorial on the same can be found here – http://www.philosophicalgeek.com/2012/07/16/how-to-debug-gc-issues-using-perfview/
Hope this little note is useful.