Recently again looking at some GC issues on IBM Websphere platform for a buddy of mine I got to learn new tool – Pattern Modeling and Analysis Tool for IBM Java Garbage Collector (PMAT). This is second post-mortem IBM analysis tool I had priviledge to work with from IBM , as I previously profiled JCA – Javacore Dump Analysis Tool here https://gennadny.wordpress.com/2016/03/28/javacore-dump-analysis-using-jca-ibm-thread-and-monitor-dump-analyzer-for-java/ .
The PMAT tool parses verbose GC trace, analyzes Java heap usage, and recommends key configurations based on pattern modeling of Java heap usage.
Why do we need it?
When the JVM (Java virtual machine) cannot allocate an object from the current heap because of lack of space, a memory allocation fault occurs, and the Garbage Collector is invoked. The first task of the Garbage Collector is to collect all the garbage that is in the heap. This process starts when any thread calls the Garbage Collector either indirectly as a result of allocation failure or directly by a specific call to System.gc(). The first step is to get all the locks needed by the garbage collection process. This step ensures that other threads are not suspended while they are holding critical locks. All other threads are then suspended. Garbage collection can then begin. It occurs in three phases: Mark, Sweep, and Compaction (optional).
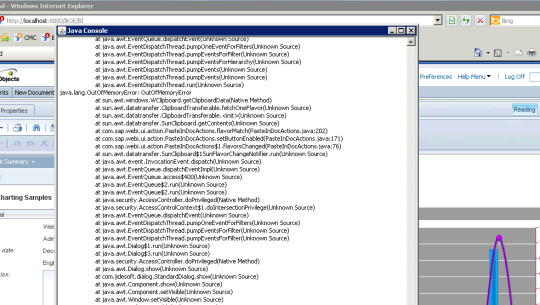
Sometimes you run into issues, most common are either performance issues in applications due to especially long running , aka “violent” GCs or rooted objects on the heap not getting cleaned up and application crashing with dreaded OutOfMemory error and causing you have to analyze Garbage Collection with Verbose GC on.
Verbose GC is a command-line option that one can supply to the JVM at start-up time. The format is: -verbose:gc or -verbosegc. This option switches on a substantial trace of every garbage collection cycle. The format for the generated information is not designed and therefore varies among various platforms and releases.
This trace should allow one to see the gross heap usage in every garbage collection cycle. For example, one could monitor the output to see the changes in the free heap space and the total heap space. This information can be used to determine whether garbage collections are taking too long to run; whether too many garbage collections are occurring; and whether the JVM crashed during garbage collection.
How does it work?
PMAT analyzes verbose GC traces by parsing the traces and building pattern models. PMAT recommends key configurations by executing a diagnosis engine and pattern modeling algorithm. If there are any errors related with Java heap exhaustion or fragmentation in the verbose GC trace, PMAT can diagnose the root cause of failures. PMAT provides rich chart features that graphically display Java heap usage.
The following features are included:
- GC analysis
- GC table view
- Allocation failure summary
- GC usage summary
- GC duration summary
- GC graph view
- GC pattern analysis
- Zoom in/out/selection/center of chart view
- Option of changing chart color.
Where do I get it?
You can download this tool from – ftp://public.dhe.ibm.com/software/websphere/appserv/support/tools/pmat/ga456.jar
Running the tool
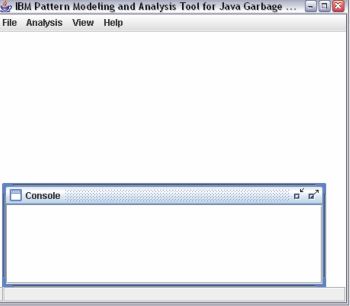
Run gaNNN.jar with the Java Run-time Environment. (NNN is the version number).
You will see following initial screen
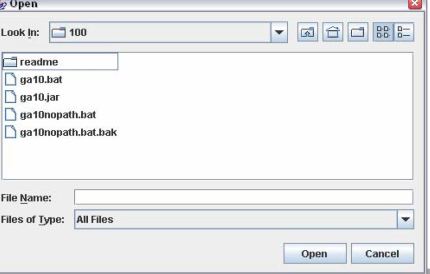
Select and open verbosegc log
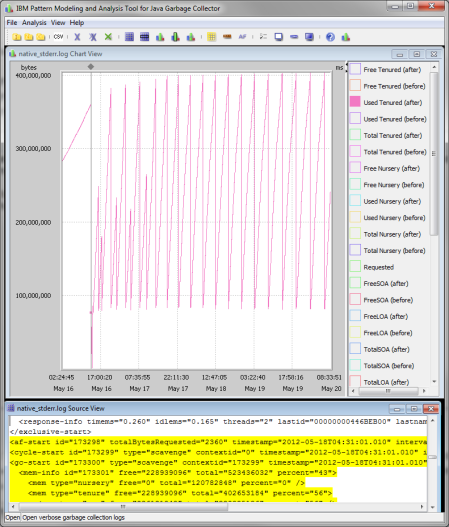
Process Log and View Summary\Reports
More detailed information on the tool can be found in presentation here – http://www-01.ibm.com/support/docview.wss?uid=swg27007240&aid=1
Jinwoo Hwang was technical leader at IBM WebSphere Application Server Technical Support that created this tool, as well as JCA. I recommend that everyone reads his articles on JVM internals – http://websphere.sys-con.com/node/1229281, http://www-01.ibm.com/support/docview.wss?uid=swg27011855 , http://www-01.ibm.com/support/docview.wss?uid=swg27018423
Hope this short note helps


